Exercise - Deploy a high-level application to your Azure Sphere
In this exercise, we'll deploy a high-level application to your Azure Sphere.
Step 1: Open the lab project
Start Visual Studio Code.
From the menu, click File, then Open Folder.
Open the Azure-Sphere lab folder.
Open the Lab_2_Send_Telemetry_to_Azure_IoT folder.
Click Select Folder or the OK button to open the project.
Step 2: Configure the Azure Sphere application
From Visual Studio Code, open the app_manifest.json file. The resources this application requires must be declared in the Capabilities section.
Update the connection properties for the Azure IoT Hub.
- Update CmdArgs with your Azure IoT DPS ID scope.
- Update DeviceAuthentication with your Azure Sphere Tenant ID. Remember, this was the numeric value returned from running the azsphere tenant show-selected command.
Update the AllowedConnections with the global device provisioning service endpoint, your DPS endpoint, and your Azure IoT Hub endpoint. See the example below to understand the correct format for these endpoints.
You can format the app_manifest.json document by right mouse clicking on the document and selecting Format Document from the context menu.
Review your updated app_manifest.json file. It should look similar to the following.
{
    "SchemaVersion": 1,
    "Name": "AzureSphereIoTCentral",
    "ComponentId": "25025d2c-66da-4448-bae1-ac26fcdd3627",
    "EntryPoint": "/bin/app",
    "CmdArgs": [ "--ConnectionType", "DPS", "--ScopeID", "0ne0099999D" ],
    "Capabilities": {
        "Gpio": [
            "$NETWORK_CONNECTED_LED",
            "$LED_RED",
            "$LED_GREEN",
            "$LED_BLUE"
        ],
        "I2cMaster": [
            "$I2cMaster2"
        ],
        "PowerControls": [
            "ForceReboot"
        ],
        "AllowedConnections": [
            "global.azure-devices-provisioning.net",
            "<Your device provisioning service endpoint>",
            "<Your Azure IoT hub endpoint>"
        ],
        "DeviceAuthentication": "9d7e79eb-9999-43ce-9999-fa8888888894"
    },
    "ApplicationType": "Default"
}
Save the updated app_manifest.json file.
IMPORTANT. Copy the contents of your app_manifest.json file to Notepad or your text editor of choice, as you'll need this configuration information for the next labs.
Step 3: Select your developer board configuration
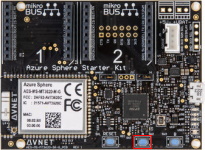
These labs support developer boards from Avnet and Seeed Studio. You need to set the configuration that matches your developer board. The default developer board configuration is for the Avnet Azure Sphere Starter Kit Revision 1. If you have this board, there is no additional configuration required.
Open CMakeLists.txt.
Add # at the beginning of the set AVNET line to disable it.
Uncomment the set command that corresponds to your Azure Sphere developer board.
set(AVNET TRUE "AVNET Azure Sphere Starter Kit Revision 1 ")
# set(AVNET_REV_2 TRUE "AVNET Azure Sphere Starter Kit Revision 2 ")
# set(SEEED_STUDIO_RDB TRUE "Seeed Studio Azure Sphere MT3620 Development Kit (aka Reference Design Board or rdb)")
# set(SEEED_STUDIO_MINI TRUE "Seeed Studio Azure Sphere MT3620 Mini Dev Board")
Save the file. This will autogenerate the CMake cache.
Step 4: Deploy the application to Azure Sphere
Start the app build and deployment process
Open main.c.
Select CMake: [Debug]: Ready from the Visual Studio Code status bar.
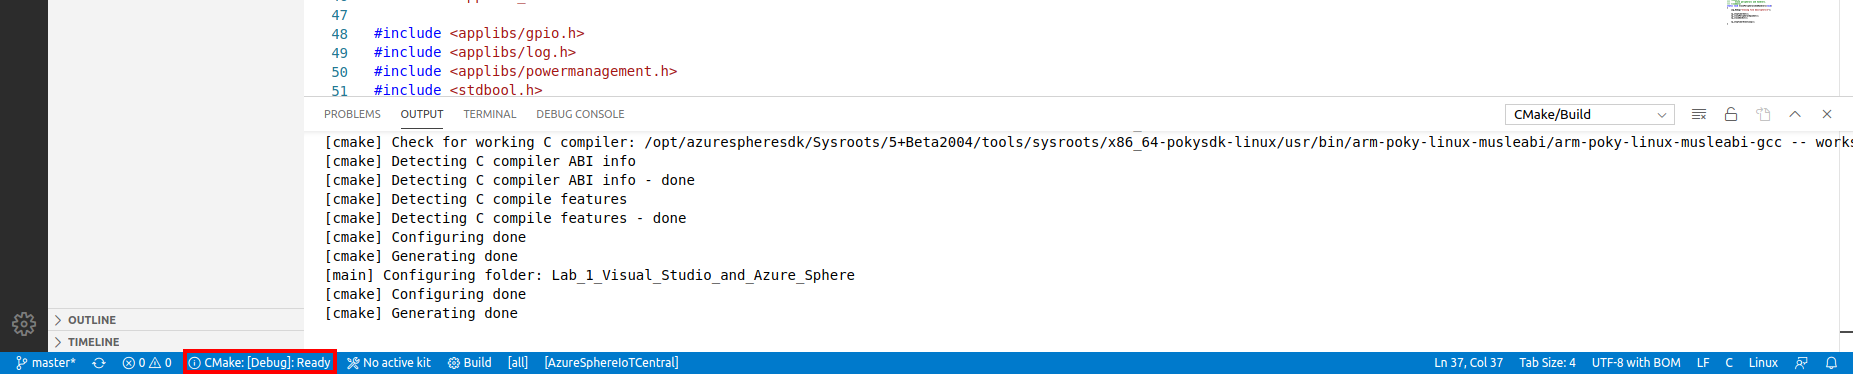
From Visual Studio Code, press F5 to build, deploy, start, and attach the remote debugger to the application now running the Azure Sphere device.
Try setting a breakpoint in the MeasureSensorHandler function. The function will be called every 5 seconds.
Note
You can learn how to set breakpoints from this Visual Studio Code Debugging article.

View debugger output
Select the Visual Studio Code Output tab to view the output from Log_Debug statements in the code.
Tip
You can open the output tab by using the Visual Studio Code Ctrl+Shift+U shortcut or clicking the Output tab.
You'll see the device negotiating security, and then it will start sending telemetry to Azure IoT Hub.
Note
You may see a couple of ERROR: failure to create IoTHub Handle messages displayed. These messages occur while the connection to Azure IoT Hub is being negotiated.
Step 5: Expected device behavior
Azure Sphere MT3620 Starter Kit Revision 1 and 2
- The WLAN LED will blink every 5 seconds when connected to Azure.
Seeed Studio Azure Sphere MT3620 Development Kit
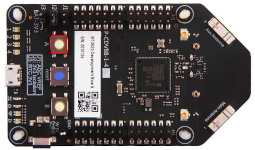
- The WLAN LED will blink every 5 seconds when connected to Azure.
Seeed Studio MT3620 Mini Dev Board
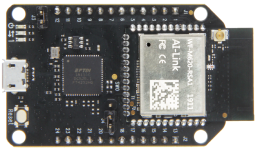
- The User LED will blink every 5 seconds when connected to Azure.
Step 6: Display the device telemetry using Azure IoT Explorer
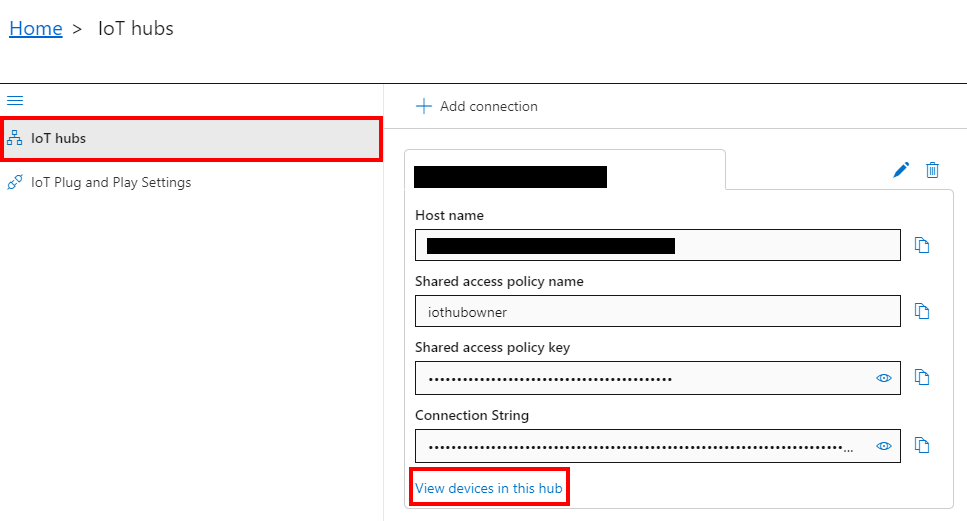
Start Azure IoT Explorer.
Click View devices in this hub.
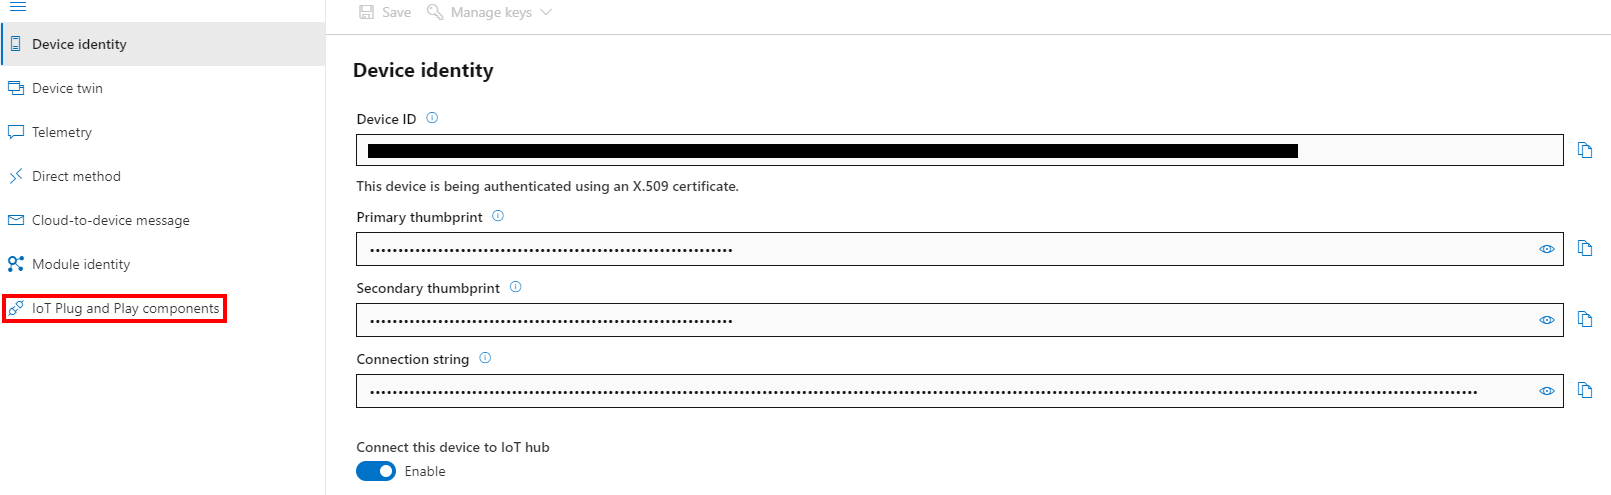
Click on your device.
The device name is your Azure Sphere Device ID. You can display your Device ID by running the following command from the Windows PowerShell command line or Linux Terminal.
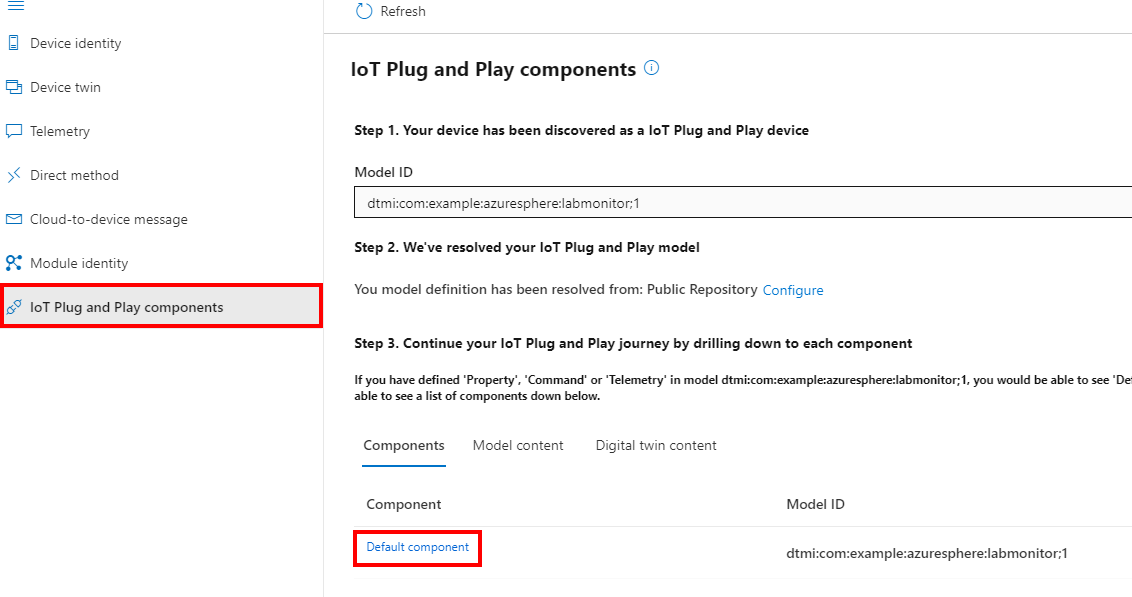
azsphere device show-attachedClick IoT Plug and Play components from the side menu.
Click Default component.
Select Telemetry from the menu.
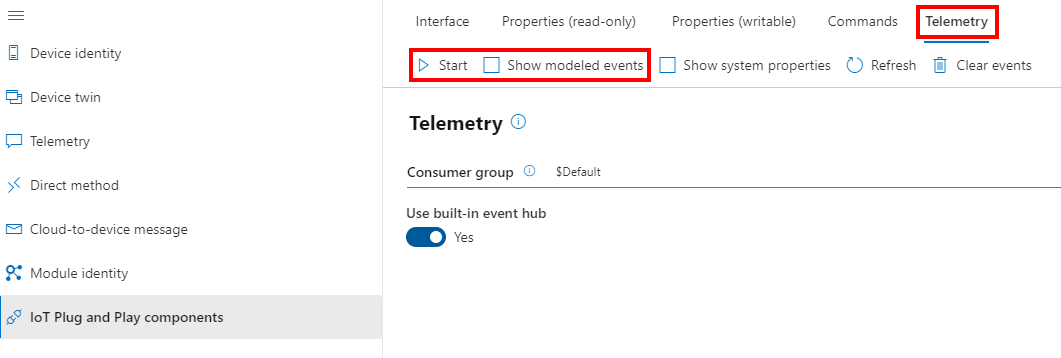
Click the Start button.
Click the Show modeled events to map the IoT Plug and Play model to the telemetry.


Close Visual Studio Code
Now close Visual Studio Code.