Examine metrics for Azure IoT Hub
In Azure Monitor, metrics are a series of measured values and counts that are collected and stored over time. Metrics can be standard (also called platform) or custom. IoT Hub includes over 80 IoT Hub standard metrics that you can use to analyze your Azure IoT Hub data. These metrics reflect the health and usage statistics of your Azure resources.
Azure IoT Hub overview page
For many Azure resources, you can view data collected by Azure Monitor in the following standard charts that are included on the Azure IoT Hub Overview page:
- Connected devices
- Device to cloud messages
- Number of messages used
- Total IoT devices
Select any of the graphs to open the data in metrics explorer in the Azure portal, which allows you to chart the values of multiple metrics over time. You can view the charts interactively or pin them to a dashboard to view them with other visualizations.
Metrics Explorer
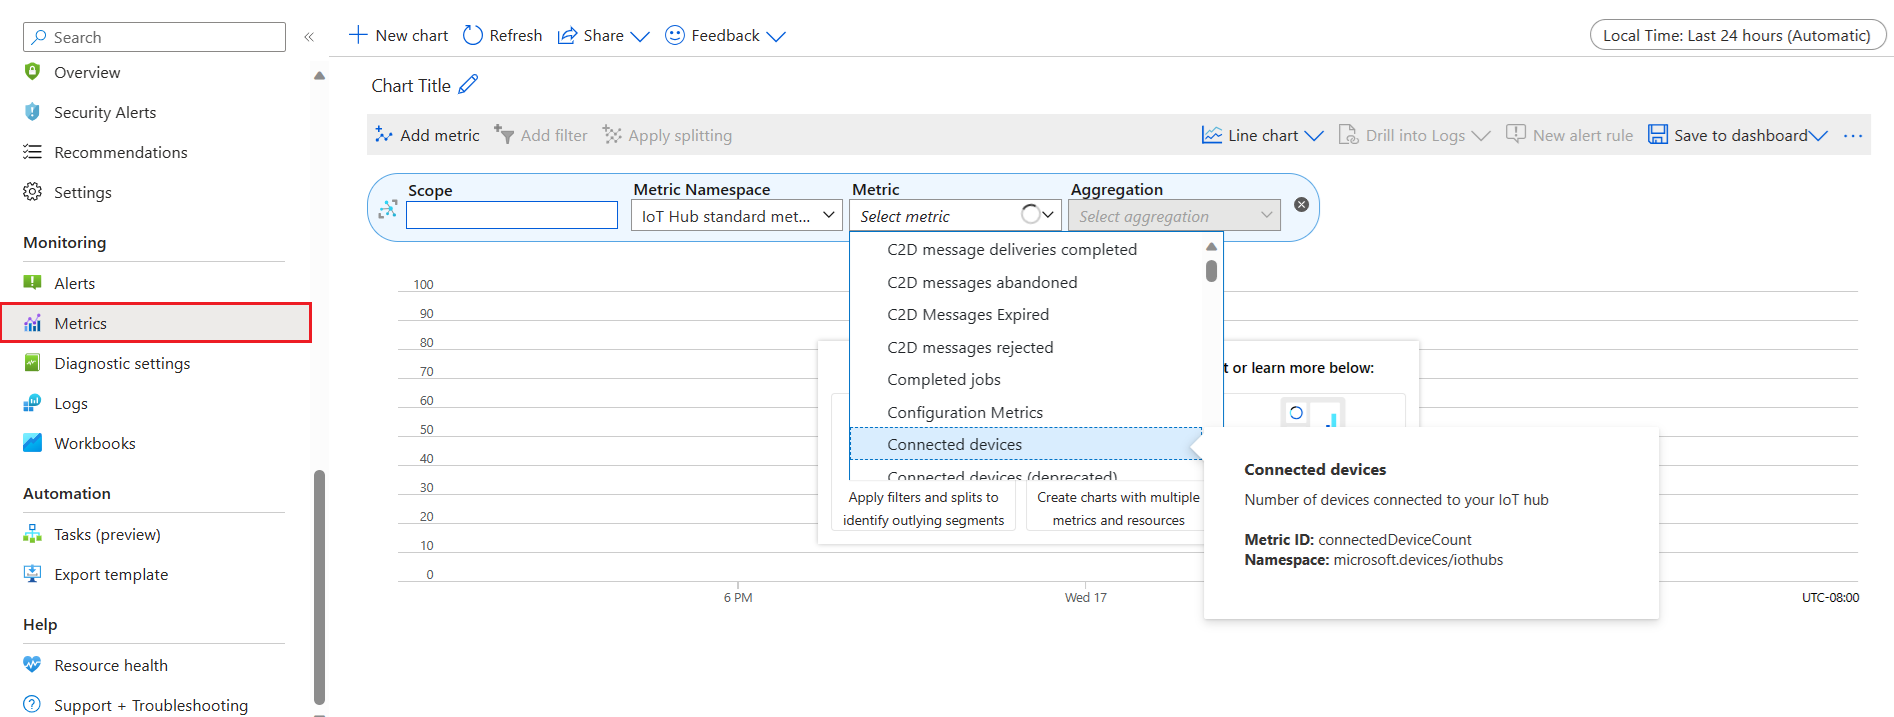
Metrics explorer is a component of the portal Azure IoT Hub blade that you can use to plot charts, visually correlate trends, and investigate spikes and dips in metrics values. You can use metrics explorer to investigate the health and utilization of your resources. Use metrics explorer to combine information from multiple metrics to paint a bigger picture of the state of your Azure IoT hub.
To open metrics explorer, navigate to the Azure portal and open your IoT hub, then in the menu Monitoring section, select Metrics. This explorer is scoped, by default, to the platform metrics emitted by your Azure IoT hub.
For more information about metrics explorer, see Analyze metrics with Azure Monitor metrics explorer.
The Azure IoT Hub standard metrics are described at: