Examine Log Analytics for Azure IoT Hub
Log Analytics is a tool you access from the Azure IoT Hub Logs menu item to edit and run log queries against data in the Azure Monitor Logs store.
Data in Azure Monitor Logs is stored in tables where each table has its own set of unique properties. The data in these tables are associated with a Log Analytics workspace and can be queried using Log Analytics.
To route data to Azure Monitor Logs, create a diagnostic setting to send resource logs or platform metrics to a Log Analytics workspace.
Log Analytics queries use the Kusto query language. For example, you could write a query that returns a set of records and then use features of Log Analytics to sort, filter, and analyze them. Or you might write a more advanced query to perform statistical analysis and analyze the results in a chart to identify a particular trend.
Whether you work with the results of your queries interactively or use them with other Azure Monitor features, such as log query alerts or workbooks, Log Analytics is the tool that you use to write and test them.
Use Log Analytics
To use Log Analytics, navigate to the Azure portal and open your Azure IoT hub, then select Logs from the menu Monitoring section. These Log Analytics queries are scoped, by default, to the logs and metrics collected in Azure Monitor Logs for your Azure IoT hub.
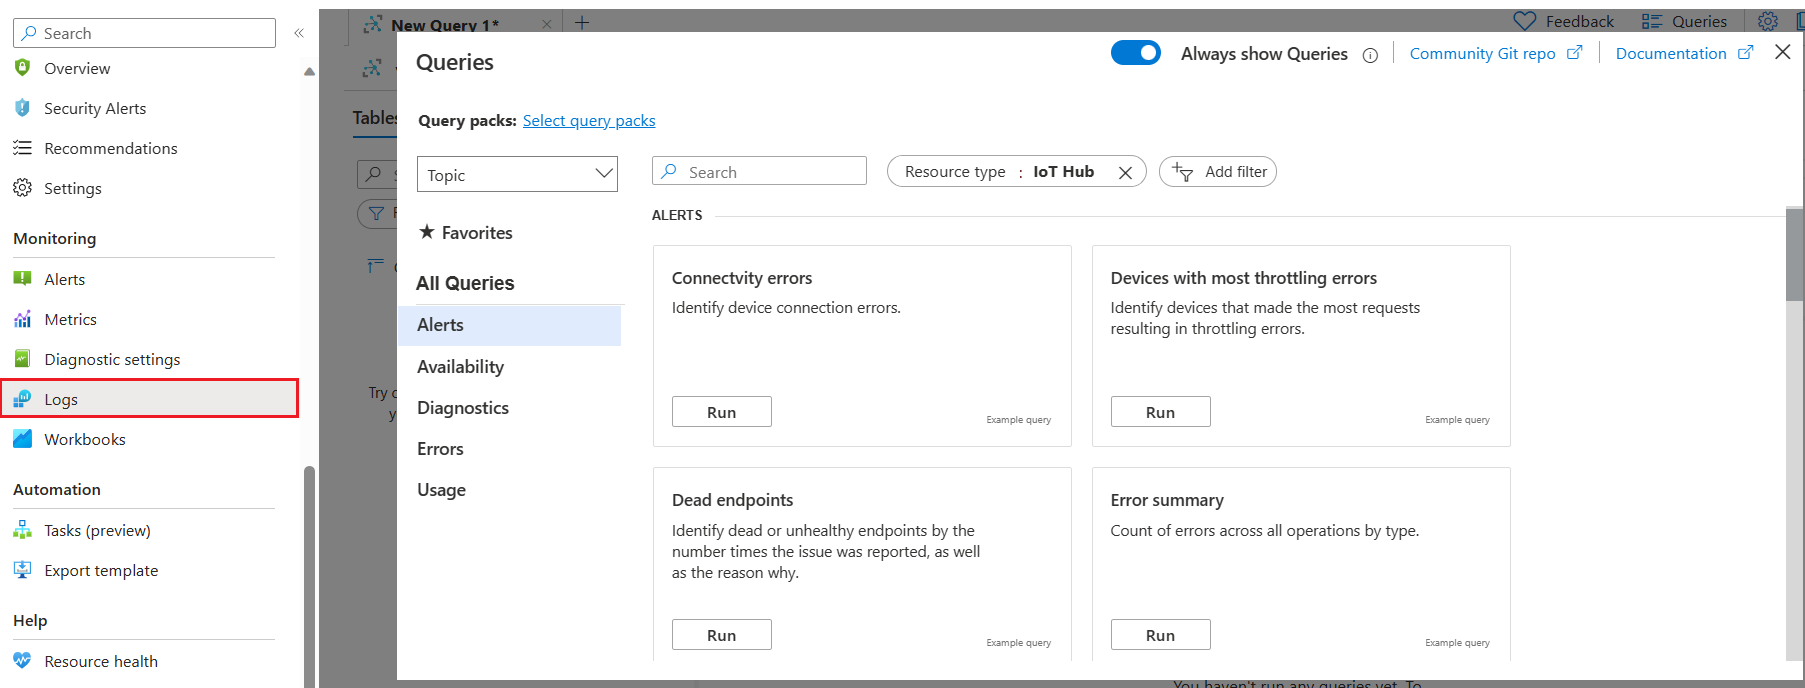
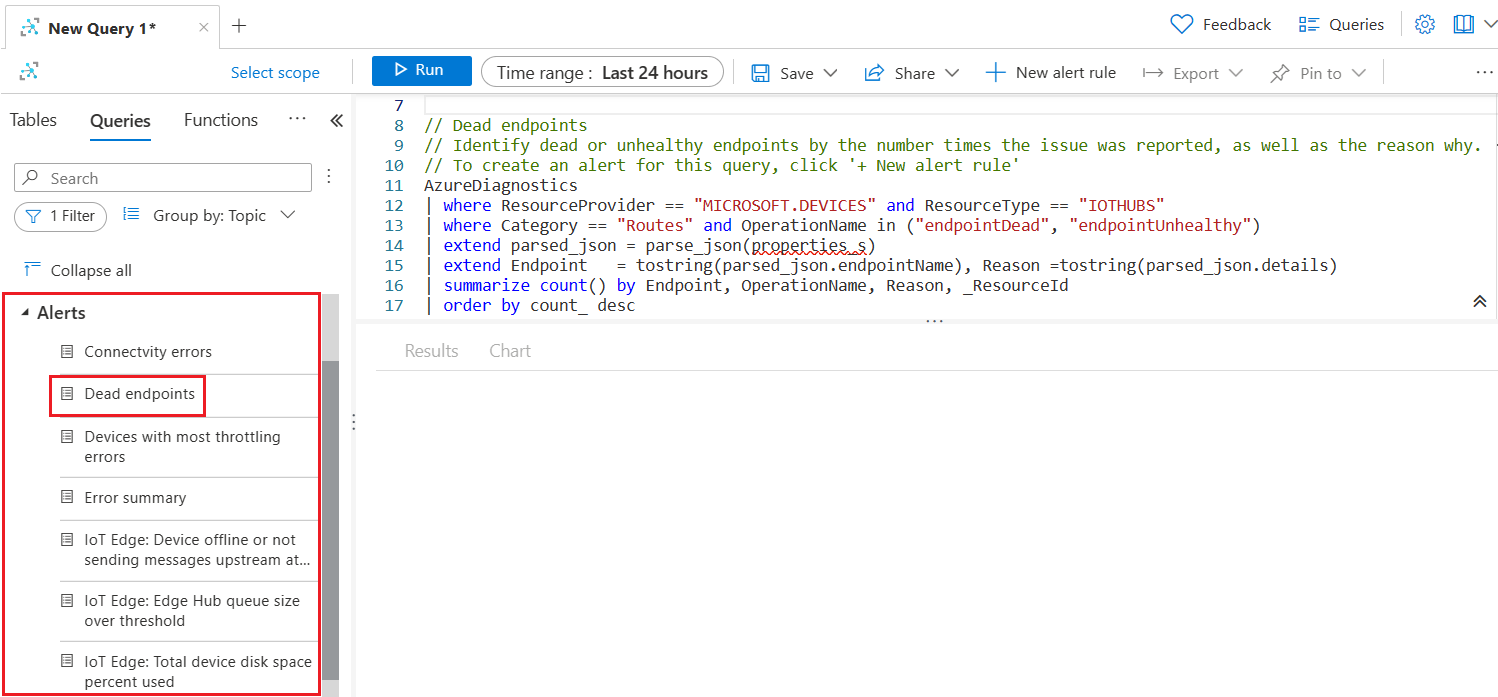
Use the Log Analytics editor to edit or create queries. Select Run to execute a query.
In this example, the Dead Endpoints query has been selected from the sample Kusto queries menu.
For a list of IoT Hub tables used by Azure Monitor Logs and queryable by Log Analytics, see Azure Monitor Logs tables in the Monitoring Azure IoT Hub data reference.
Sample Kusto queries
Azure IoT Hub Log Analytics includes the following Kusto queries to help monitor your Azure IoT Hub. To view a Kusto query definition for the following queries, see Sample Kusto queries.
- Connectivity Errors - Identify device connection errors.
- Throttling Errors - Identify devices that made the most requests resulting in throttling errors.
- Dead Endpoints - Identify dead or unhealthy endpoints by the number of times the issue was reported and know the reason why.
- Error summary - Count of errors across all operations by type.
- Recently connected devices - List of devices that Azure IoT Hub saw connect in the specified time period.
- Connection events for a specific device - All connection events logged for a specific device.
- SDK version of devices - List of devices and their SDK versions for device connections or device to cloud twin operations.
For more information about Log Analytics, see Overview of Log Analytics in Azure Monitor.
Analyze Activity Logs
The Activity log is a platform log in Azure that provides insight into subscription-level events. You can view it independently or route it to Azure Monitor Logs, where you can perform more complex queries using Log Analytics.
When routing Azure IoT Hub platform metrics to Azure Monitor Logs:
The following platform metrics aren't exportable via diagnostic settings: Connected devices and Total devices.
Multi-dimensional metrics, for example some routing metrics, are currently exported as flattened single dimensional metrics aggregated across dimension values. For more detail, see Exporting platform metrics to other locations.