Describe reporting capabilities including charts, dashboards, and views
Dynamics 365 provides multiple reporting options available out of the box to provide users with some basic reporting on their data. All the reporting options in Dynamics 365 CRM apps are configurable and enforce established security roles for data access.
Views
When you create views, you create analytics based on the data that is important to you. When you view records, you can apply filters to drill down into the detail that is important to you.
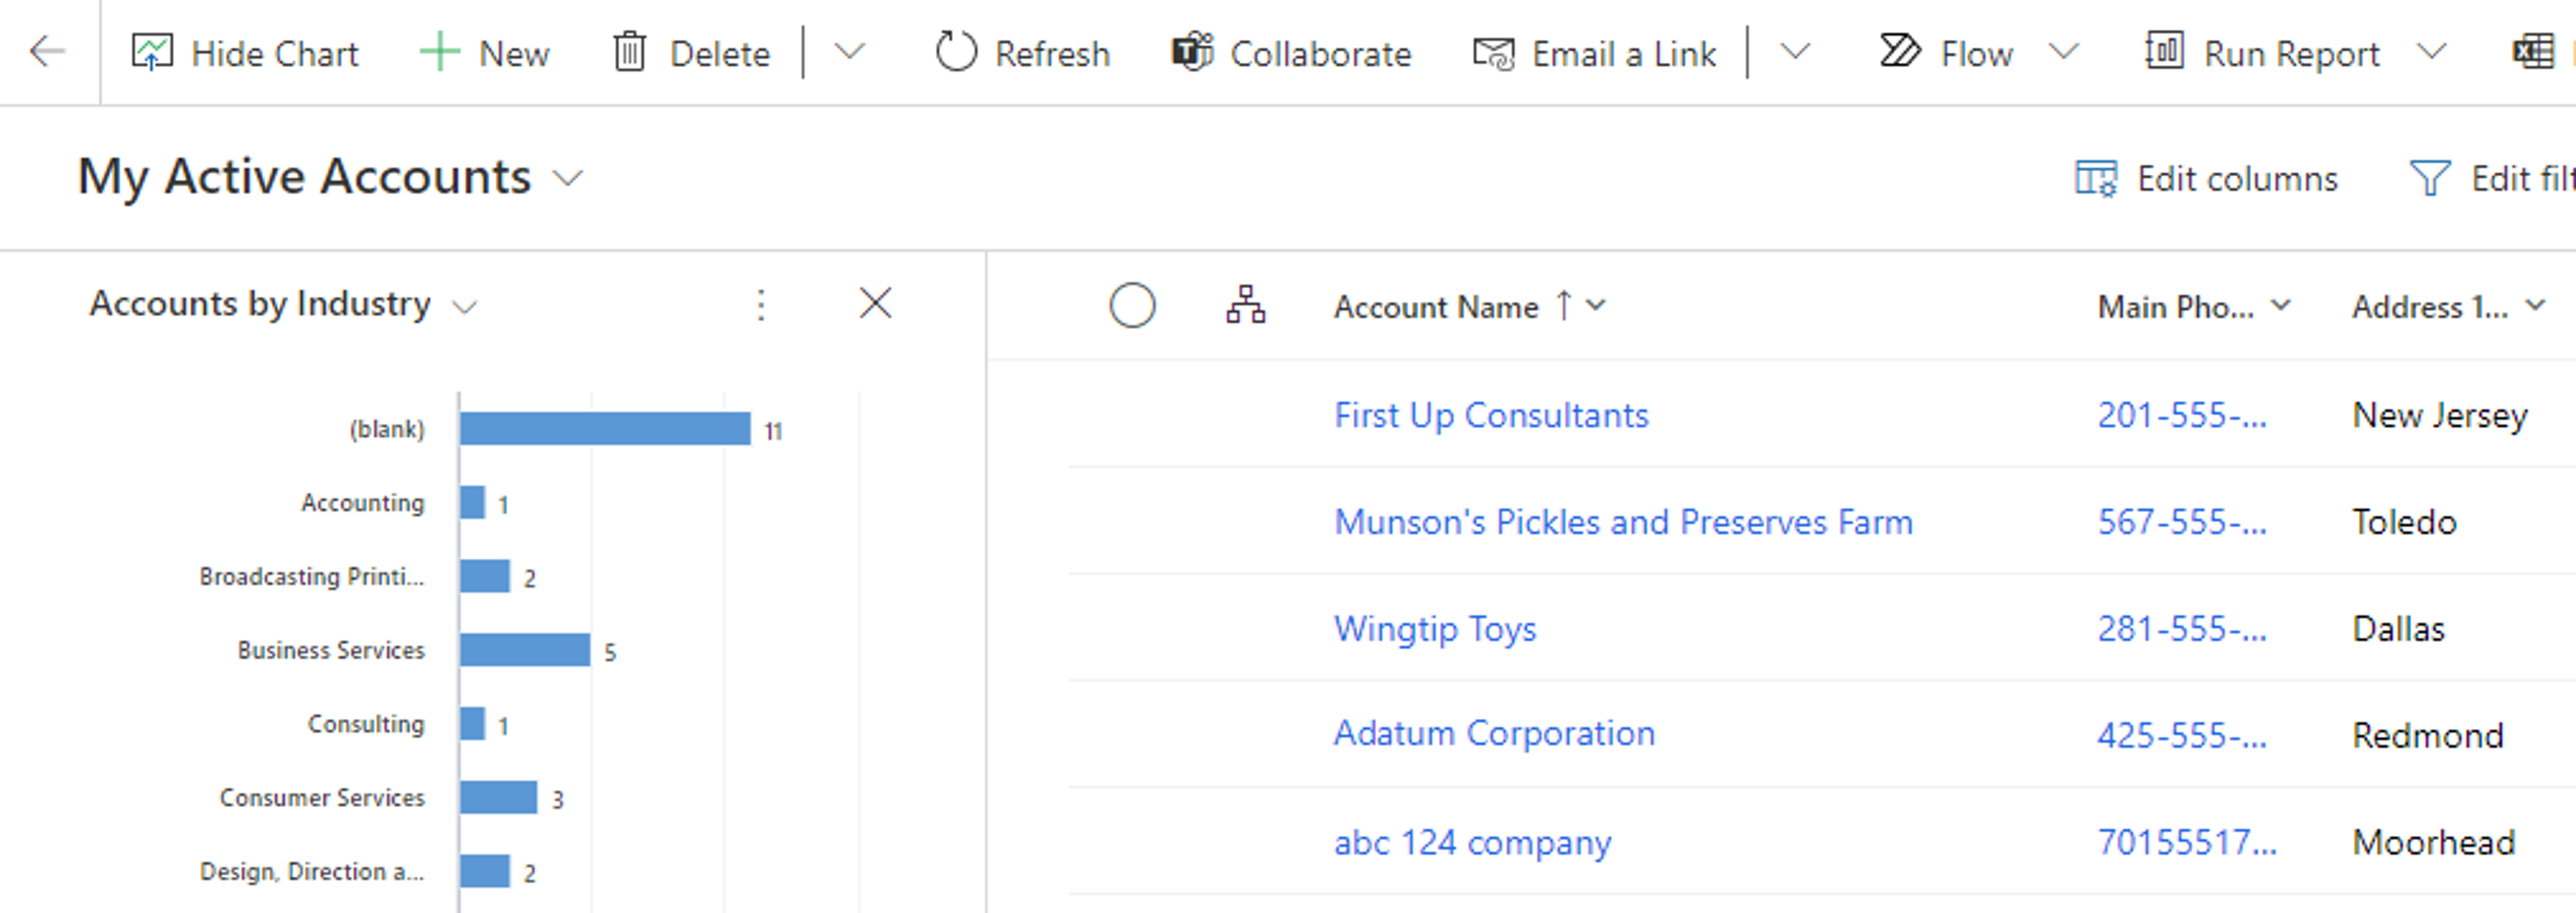
Charts
Charts are quick and actionable visualizations of your data. The charts are interactive so you can continue to drill down into relevant data. You can also place charts on dashboards and view them in line with the data they're displaying.
Dashboards
Both standard and interactive dashboards offer a combination of charts and views in an easy to consume experience.
Dashboards are a collection of:
Views
Charts
Iframe
Web resources
The advantage of dashboards is that you can easily obtain a high-level overview of data all in one diagram. Based on the first party application that you're using, there are different dashboard options available.
The screenshot shows an example of a Dynamics 365 Sales dashboard.

Power BI
There are times when the out-of-the-box reporting tools available in the Dynamics 365 customer engagement apps don't meet the needs of an organization. In those instances, Power BI reports can be built from the Dynamics 365 data. Power BI is a collection of software services, apps, and connectors that work together to turn unrelated sources of data into coherent, visually immersive, and interactive insights. Once created, Power BI dashboards can be embedded in Dynamics 365 applications. This makes it easy for users to not only use the capabilities provided by the out-of-the-box reports as needed, but also allows them to access more advanced reporting through embedded Power BI reports.
