Explore threat analytics in Microsoft 365
Threat analytics is Microsoft's in-product threat intelligence solution. Microsoft's expert team of security researchers designed it to assist security teams to be as efficient as possible while facing emerging threats, such as:
- Active threat actors and their campaigns
- Popular and new attack techniques
- Critical vulnerabilities
- Common attack surfaces
- Prevalent malware
High impact threats have the greatest potential to cause harm. High exposure threats are the ones that your assets are most vulnerable to. Getting visibility on active or ongoing campaigns and knowing what to do through threat analytics can help equip your security operations team with informed decisions.
With more sophisticated adversaries and new threats emerging frequently and prevalently, it's critical to be able to quickly:
- Identify and react to emerging threats.
- Learn if you're currently under attack.
- Assess the effect of the threat to your assets.
- Review your resilience against or exposure to the threats.
- Identify the mitigation, recovery, or prevention actions you can take to stop or contain the threats.
The Threat Analytics reports provide analysis of a tracked threat. They also provide guidance on how to defend against that threat. Each report incorporates data from your network, indicating whether the threat is active and if you have applicable protections in place.
Additional viewing. Select the following link to watch a short video about how threat analytics can help you track the latest threats and stop them: Microsoft Defender XDR Threat Analytics.
View the threat analytics dashboard
You can access the Threat analytics dashboard from the navigation pane in the Microsoft Defender portal.
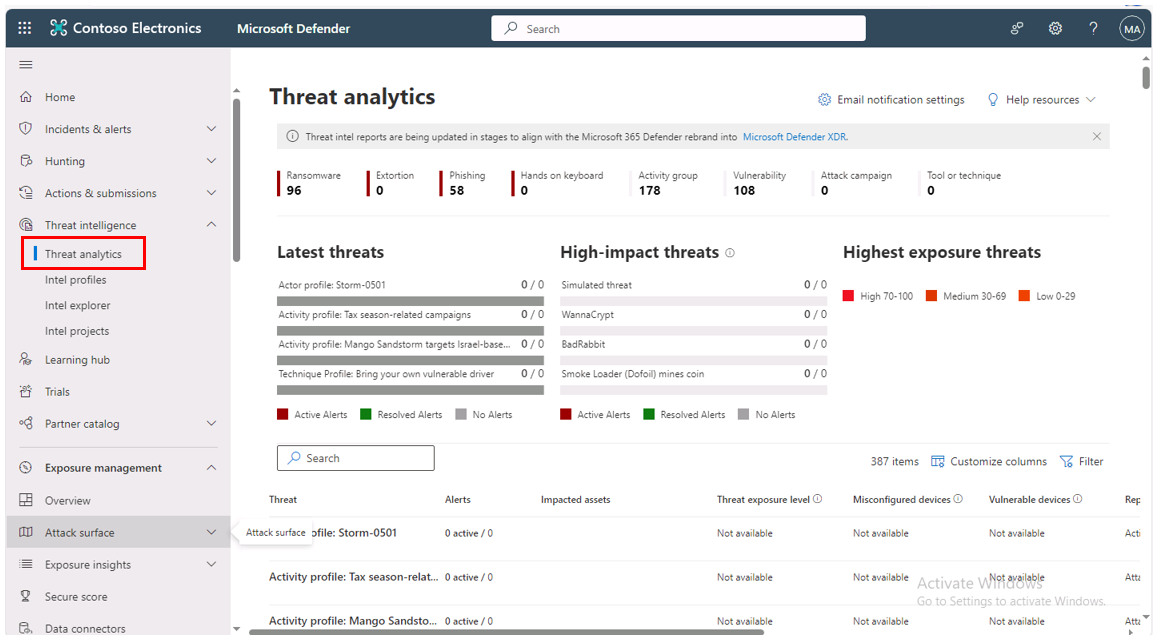
The threat analytics dashboard highlights the reports that are most relevant to your organization. It summarizes the threats in the following sections:
- Latest threats. Lists the most recently published or updated threat reports, along with the number of active and resolved alerts.
- High-impact threats. Lists the threats that have the greatest effect on your organization. This section lists threats with the highest number of active and resolved alerts first.
- Highest exposure threats. Lists threats with the highest exposure levels first. The system calculates the exposure level of a threat using two pieces of information:
- The severity of the vulnerabilities associated with the threat.
- The number of devices in the organization that an attacker can exploit using those vulnerabilities.
Select a threat from the dashboard to view the report for that threat. You can also select the Search field to enter a keyword related to the threat analytics report you would like to see.
View a threat analytics report
Each threat analytics report provides information in several tabs:
- Overview
- Analyst report
- Related incidents
- Impacted assets
- Prevented email attempts
- Exposure & mitigations
The following sections examine each of these tabs in greater detail.
Overview tab: Quickly understand the threat, assess its impact, and review defenses
The Overview tab provides a preview of the detailed analyst report. It also provides charts that highlight:
- The impact of the threat to your organization.
- Your exposure through misconfigured and unpatched devices.
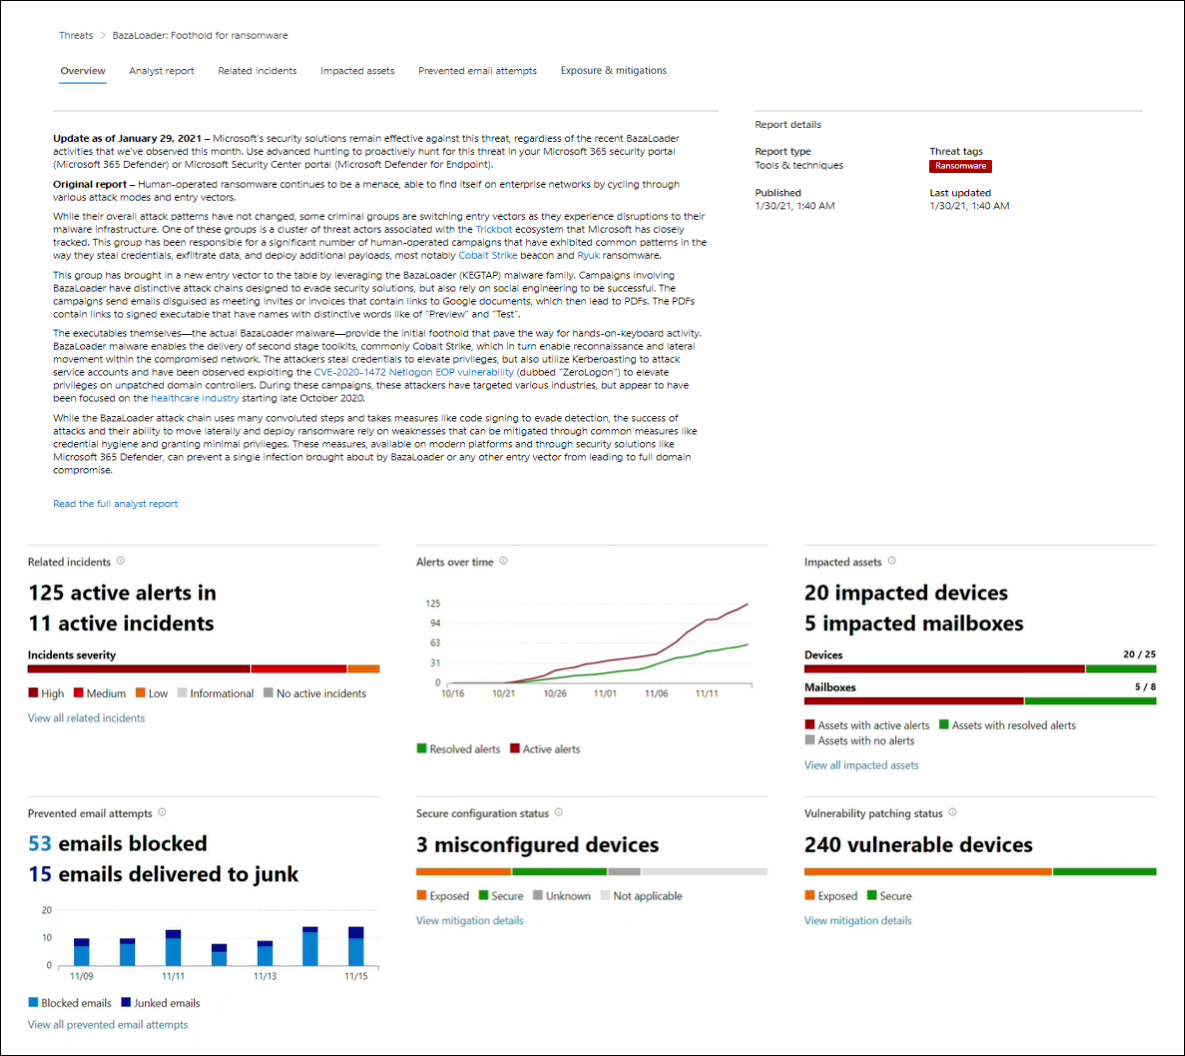
Each report includes charts designed to provide information about the organizational impact of a threat:
- Related incidents. Provides an overview of the impact of the tracked threat to the organization with the following data:
- Number of active alerts and the number of active incidents they're associated with.
- Severity of active incidents.
- Alerts over time. Shows the number of related Active and Resolved alerts over time. The number of resolved alerts indicates how quickly the organization responds to alerts associated with a threat. Ideally, the chart should be showing alerts resolved within a few days.
- Impacted assets. Shows the number of distinct devices and email accounts (mailboxes) with at least one active alert associated with the tracked threat. The system triggers alerts for mailboxes that received threat emails. Organizations should review both org- and user-level policies for overrides that cause the delivery of threat emails.
- Prevented email attempts. Shows the number of emails from the past seven days that the system either blocked before delivery or delivered to the junk mail folder.
Each report includes charts that provide an overview of how resilient the organization is against a given threat:
- Secure configuration status. Shows the number of devices with misconfigured security settings. Organizations should apply the recommended security settings to help mitigate the threat. The system considers devices Secure if the organization applied all the tracked settings.
- Vulnerability patching status. Shows the number of vulnerable devices. Organizations should apply security updates or patches to address vulnerabilities exploited by the threat.
You can filter the threat report list and view the most relevant reports according to a specific threat tag (category) or a report type.
- Threat tags. Assist you in viewing the most relevant reports according to a specific threat category. For example, all reports related to ransomware.
- Report types. Assist you in viewing the most relevant reports according to a specific report type. For example, all reports that cover tools and techniques.
- Filters. Assist you in efficiently reviewing the threat report list and filtering the view based on a specific threat tag or report type. For example, review all threat reports related to ransomware category, or threat reports that cover vulnerabilities.
The Microsoft Threat Intelligence team added threat tags and other key information to each threat report:
- Four threat tags are now available:
- Ransomware
- Phishing
- Vulnerability
- Activity group
- The top of the Threat Analytics page displays threat tags.
- There are counters for the number of available reports under each tag.
- You can sort the list by threat tags.
- Filters are available per threat tag and report type.
Analyst report tab: Get expert insight from Microsoft security researchers
The Analyst report tab includes detailed expert analysis on the threat. Most reports provide detailed descriptions of attack chains. These descriptions include:
- Tactics and techniques mapped to the MITRE ATT&CK framework.
- Exhaustive lists of recommendations.
- Powerful threat hunting guidance.
Additional reading. For more information, see Learn more about the analyst report.
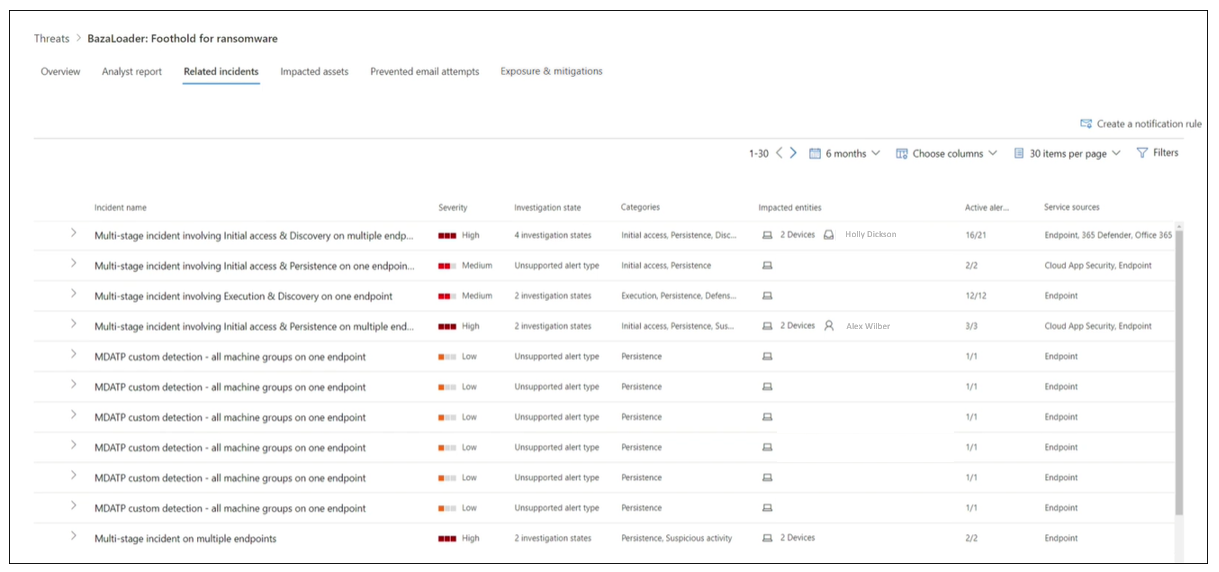
Related incidents tab: View and manage related incidents
The Related incidents tab provides the list of all incidents related to the tracked threat. You can assign incidents or manage alerts linked to each incident.
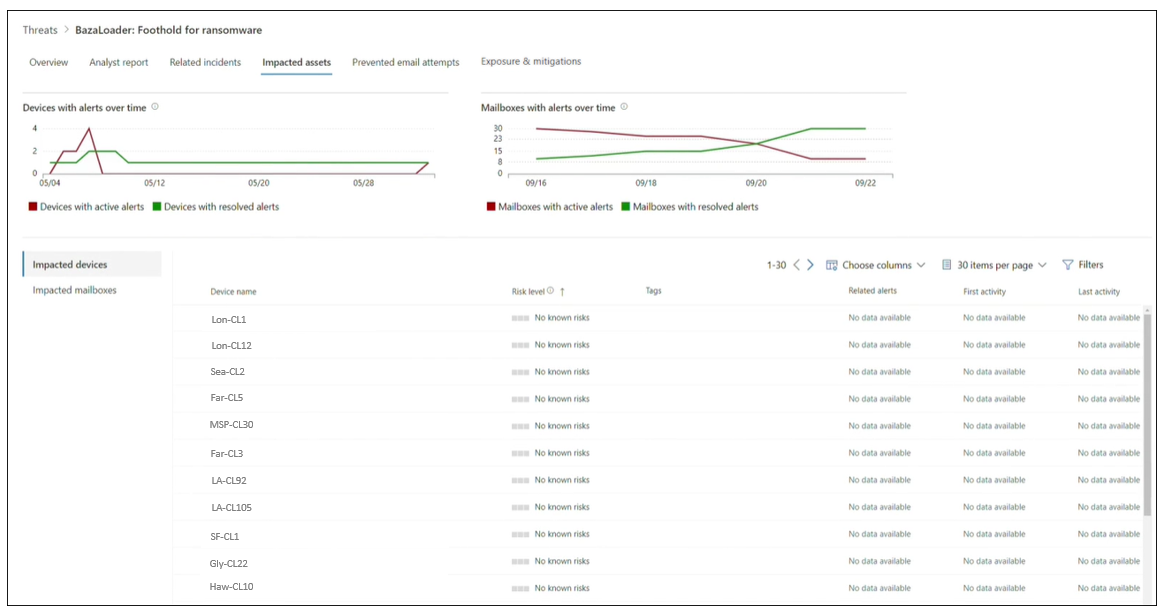
Impacted assets tab: Get list of impacted devices and mailboxes
When an active, unresolved alert affects an asset, the system considers the asset "impacted." The Impacted assets tab lists the following types of impacted assets:
- Devices. Endpoints that have unresolved Microsoft Defender for Endpoint alerts. These alerts typically fire on sightings of known threat indicators and activities.
- Mailboxes. Mailboxes that received email messages that triggered Microsoft Defender for Office 365 alerts. While the system typically blocks most messages that trigger alerts, user- or org-level policies can override filters.
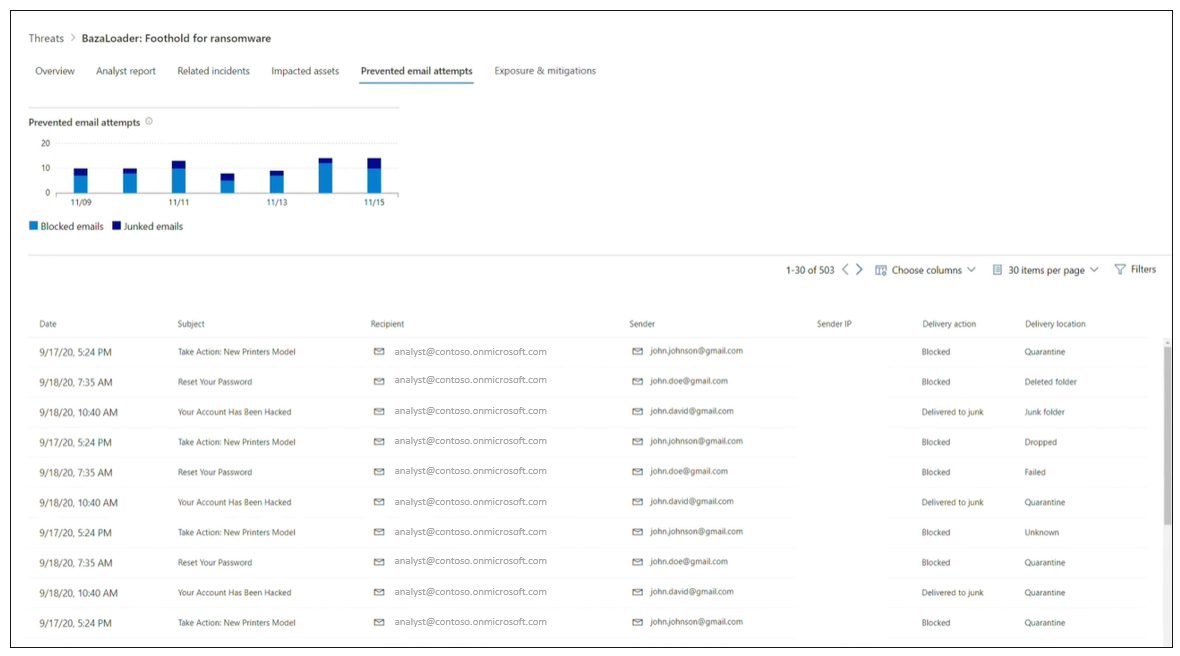
Prevented email attempts tab: View blocked or junked threat emails
Microsoft Defender for Office 365 typically blocks emails with known threat indicators, including malicious links or attachments. In some cases, proactive filtering mechanisms that check for suspicious content instead send threat emails to the junk mail folder. Each case reduces the chance of the threat launching malware code on the device.
The Prevented email attempts tab lists all the emails Microsoft Defender for Office 365 either blocked before delivery or sent to the junk mail folder.
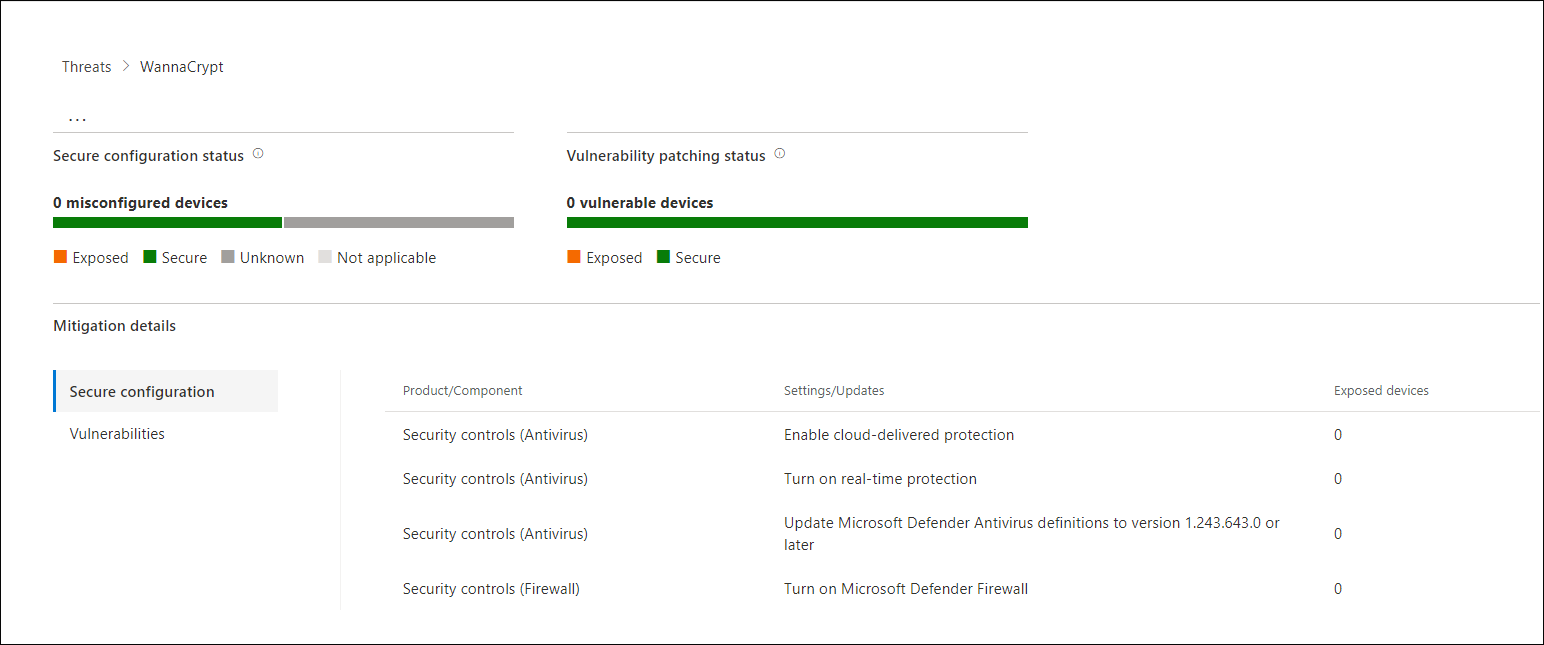
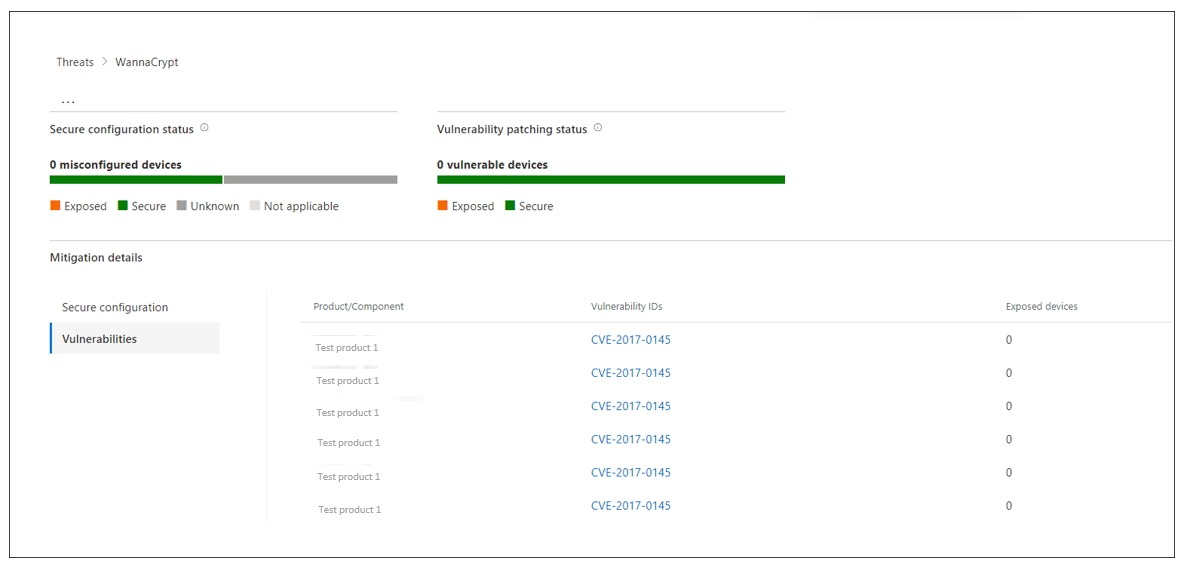
Exposure and mitigations tab: Review list of mitigations and the status of your devices
In the Exposure and mitigations section, an organization should review the list of specific actionable recommendations that can help increase its resilience against the threat. The list of tracked mitigations includes:
- Security updates. Deployment of supported software security updates for vulnerabilities found on onboarded devices
- Supported security configurations. These mitigations include:
- Cloud-delivered protection
- Potentially unwanted application (PUA) protection
- Real-time protection
Mitigation information in this tab incorporates data from threat and vulnerability management. This feature also provides detailed drill-down information from various links in the report.