Group data using aggregate functions
Organizations in all sectors deal with a constant flow of data, and need to turn this data into meaningful, actionable insights. In the meteorological scenario, you've obtained a dataset with storm data from the US. You've seen in a previous module how to construct basic queries to explore the data.
In this unit, you'll learn about comparing groups of data and presenting the results visually by using the Kusto Query Language (KQL).
Compare groups of data
The data in the storm events scenario is presented on an event level, meaning that each row represents a specific storm event and its associated information. That's a lot of individual storms, and it can be difficult to gain meaningful insights by looking at individual events. If you group these individual events by common fields (for example: location), then you can make meaningful comparisons across groups.
An aggregation function allows you to make these comparisons by grouping values of multiple rows to form a single summary value. The type of summary value depends on the specific function you use, and could be a count, average, maximum, minimum, or median value, just to name a few. For example, the following illustration summarizes the count of storm types by location.

Present the results visually
Once you've grouped your data, you'll want to get insights from the results. The default output for queries is tabular. However, in many scenarios, graphical representations can better communicate the results. We'll explore some of the ways to convert Kusto query results to graphical visualizations using the render operator.
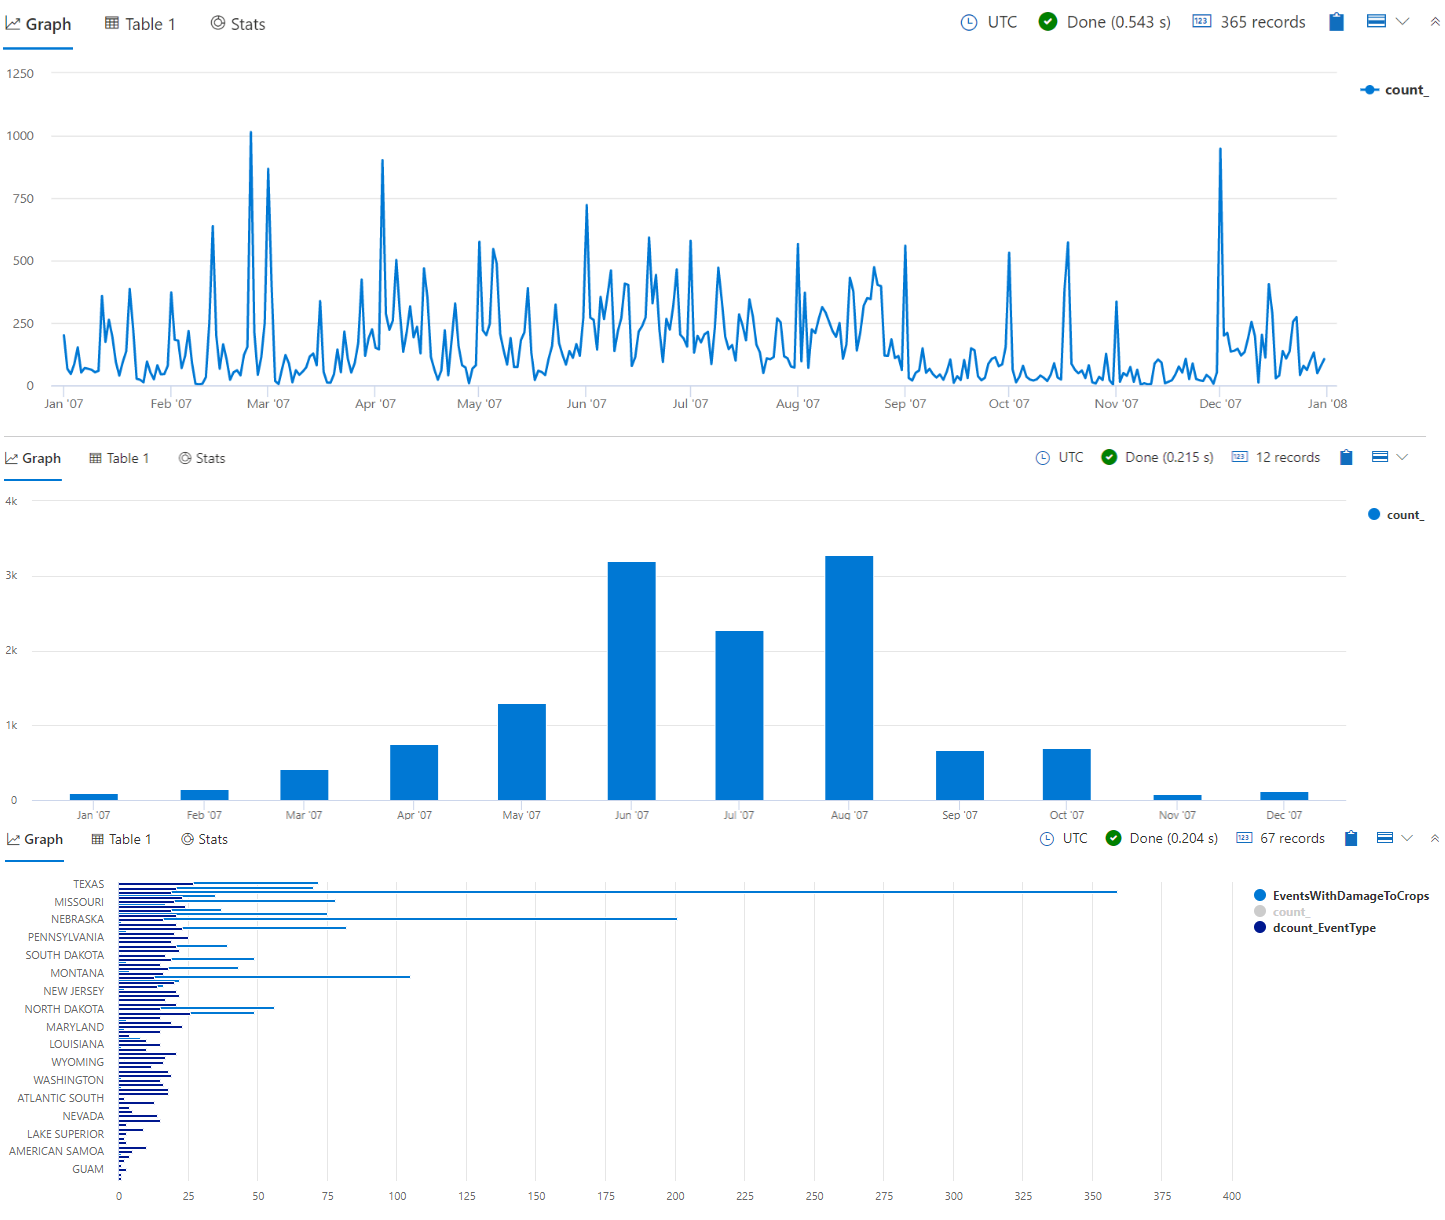
Some available types of visualization are linechart, columnchart, barchart, piechart, scatterchart, pivotchart, and others. The following image shows sample Kusto query results rendered as a line chart, column chart, and bar chart.
In the next units, we'll learn about some of the most common aggregation functions, visualize their results using the render operator, and then build complex queries. These KQL skills will help you gain insights into a sample dataset containing US meteorological data.