Identify exceptions with Connected Field Service
An important part of a connected field service application is the identification of anomalies and the escalation of those into the application where they can be acted upon. When you configure the Connected Field Service add-in for Dynamics 365 Field Service, it includes a pre-built template application that uses a temperature-based scenario with a specific format of data coming from the IoT device. This template also uses static rules to detect anomalies. In this unit, we will be looking at how to customize the template components to handle your own scenario's unique requirements. This includes handing different data being sent from the device as well as altering the rules used for evaluating the data and generating IoT Alerts.
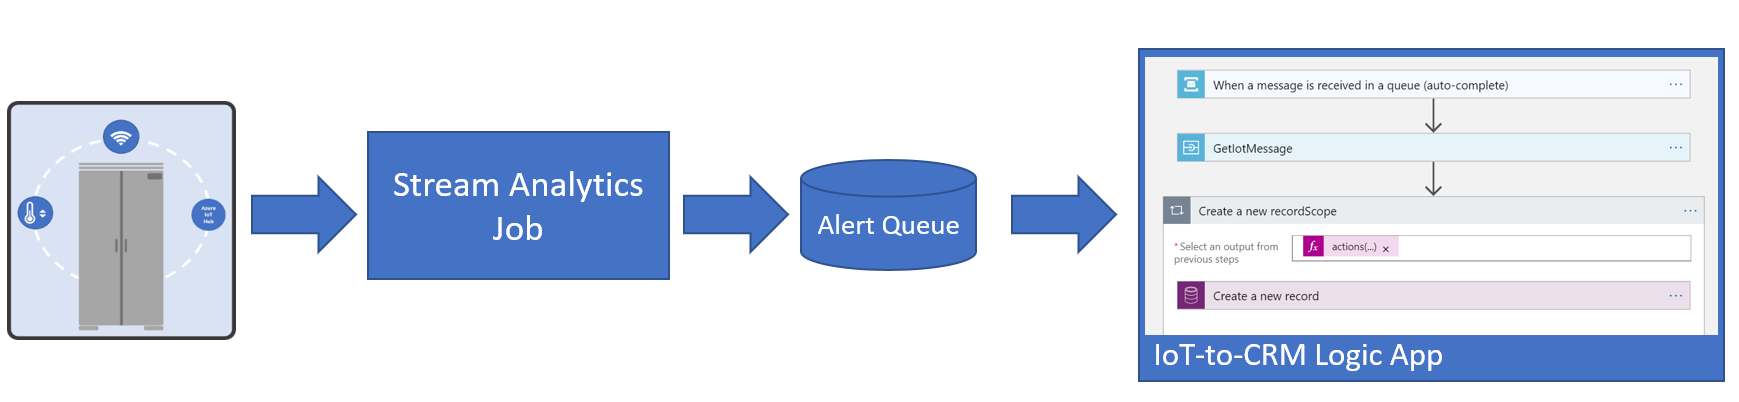
The following is the architecture used by the default components installed with the Connected Field Service add-in. The telemetry from the device is evaluated by an Azure Stream Analytics job for exceptions to the static rules.
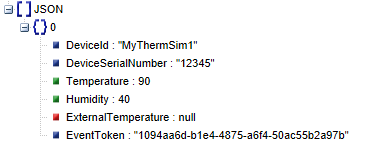
When you configured the add-in, the simulator application generates the following device data that is consumed by the Azure Stream Analytics job.
In the next unit, you'll be connecting a real device using the Azure IoT DevKit with the IoT Central firmware installed. Using that firmware, the device will generate the following data.
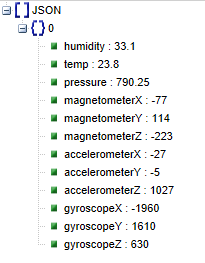
With a quick comparison, you will find a few noticeable differences. All the data attributes in the JSON are in lower case, Temperature is now also temp. The temperature is reported now in Celsius, not Fahrenheit. The real device also has more sensors and is configured to send more data. The extra data won't impact the current template components, but they could be enhanced to use that data also.
The following shows the default Stream Analytics query, so you can see how the data is currently transformed.
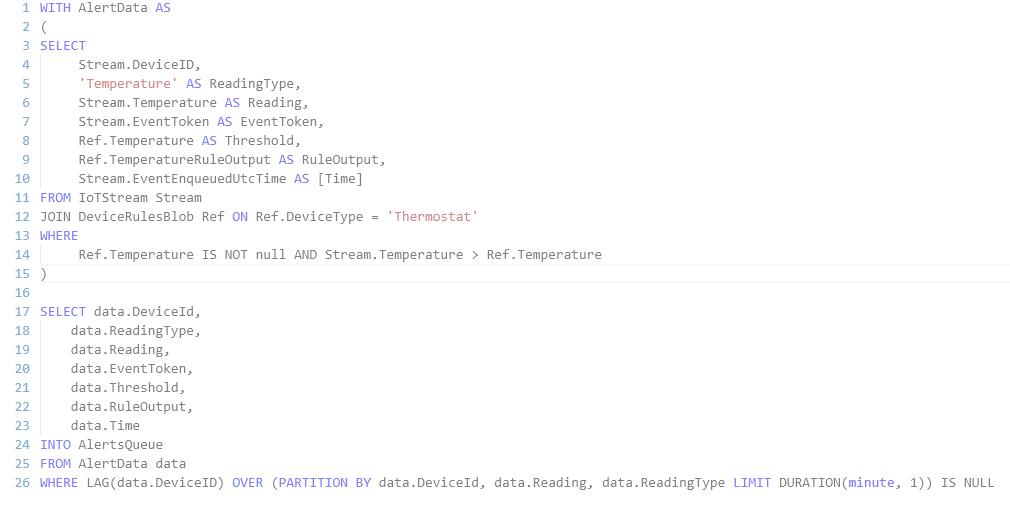
When the data is processed by the Stream Analytics job and the IoT Alert is generated some, of the raw data plus some augmented data from the rule is populated as Alert Data on the IoT Alert in the Dynamics 365 record. You can start seeing how we will need to modify this query to accommodate for the differences between the simulated device and the real device.
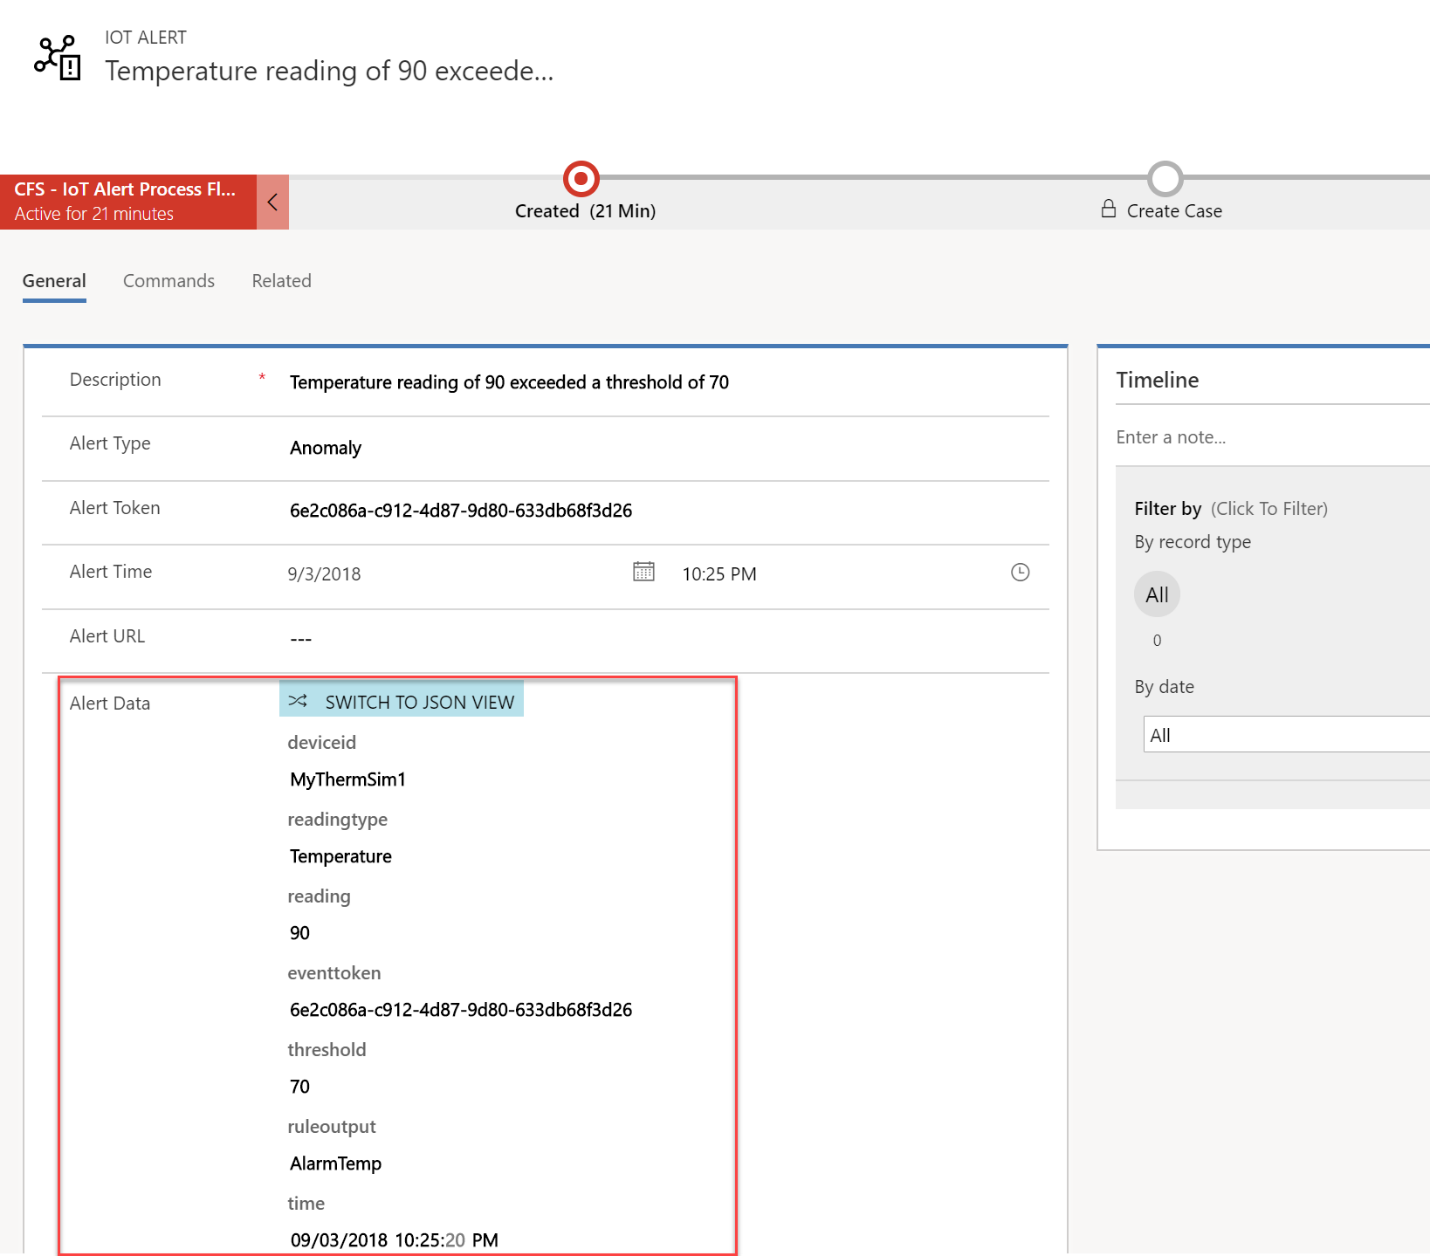
The Alert Data properties can be evaluated as part of any automation that is executed once the IoT Alert record is created. As you look at your unique scenario, you should consider what data to promote from the device telemetry into the Alert Data.
In addition to looking at alerts, you might want to store detailed telemetry, so you can drill down as part of diagnosing an alert. The default template uses an Azure SQL database combined with Power BI to give you a real-time look at the activity from your devices. Later in this module we will look at various options for storing the detail telemetry.
In the next unit, you'll be setting up your device and then later we'll be modifying the default template to pick up the new data format.