Identify exceptions
In this unit we are going to modify the Stream Analytics job to work with the data from our physical device that comes in a different format than the simulated device. We will also be adjusting the stream job to store the data into an Azure Cosmos DB in addition to evaluating it for anomalies.
Exercise 1: Using device explorer
Task 1: Download and install device explorer
Navigate to Microsoft Azure IoT Hub SDK for C# Release 2019-9-12.
Scroll down to locate SetupDeviceExplorer.msi and click on it.
Click Run.
Click Next.
Complete the installation and click Close.
Task 2: Connect
Go to your Azure portal and open the IoT Hub again.
Select Shared Access Policy and click on the iothubowner.
Copy the Connection String - Primary Key.
Start the Device Explorer you installed on your machine.
Paste the Connection String and click Update.
Click OK.
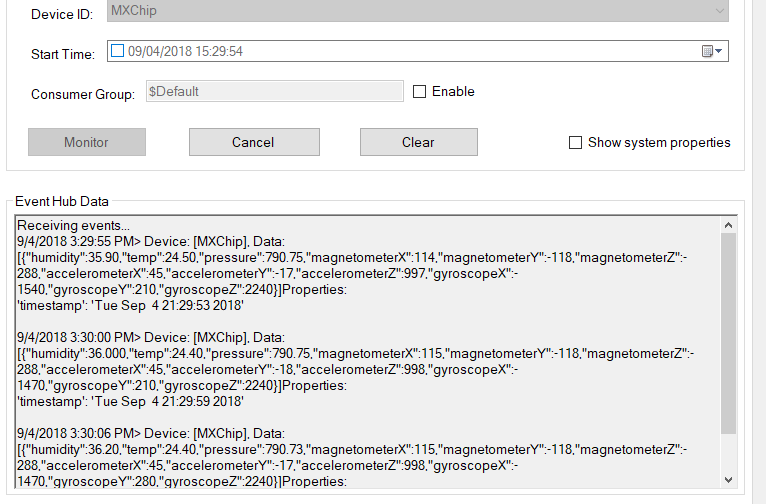
Select the Data tab and click Monitor.
You should have sensor data from your device in JSON format.
Exercise 2: Azure Cosmos DB
In this exercise, you will be pre-creating an Azure Cosmos DB that will be used in the next exercise. This database will be used to store detail telemetry from the device.
Task 1: Create Azure Cosmos DB
Go to your Azure portal and click Create a Resource.
Search for Azure Cosmos DB and select it.
Click Create.
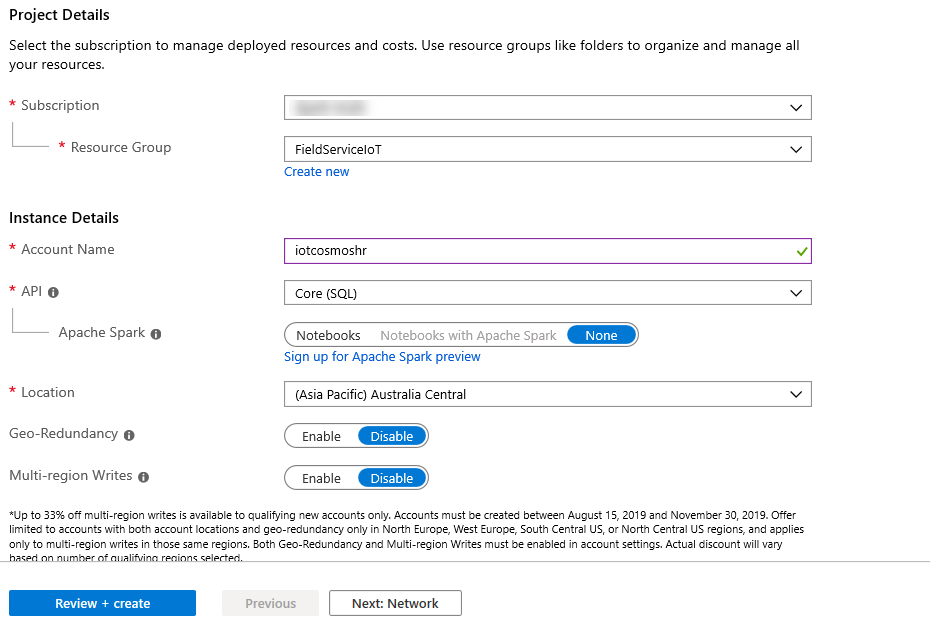
Select your Subscription, select your Resource Group, provide a unique Account Name, select Core (SQL) for API, select your Location, and click Review and Create.
Click Create and wait for the Azure Cosmos DB to be created.
Open the Azure Cosmos DB you created.
Select Data Explorer, click New Container and select New Database.
Enter Telemetry for Database ID and click OK.
Click on the ... button of the database you created.
Select New Container.
Enter DeviceData for Container ID, enter DeviceID for Partition Key, and click on the Provision checkbox.
Change the Throughput to 400, click OK. We are changing the throughput to minimize cost.
Exercise 3: Adjust Stream Analytics Job
In this exercise, you will be modifying the Azure Stream Analytics job to accommodate for the different telemetry sent by your MXChip device.
Task 1: Add Cosmos DB as an output
Select Resource Groups and open the Resource Group you created.
Locate and open the Stream Analytics Job.
Click Stop. The Stream Analytics Job must be stopped before you can change its query and input/outputs.
Click Yes.
After the Job stops, select Outputs.
Click Add and select Cosmos DB.
Enter CosmosDB for Output Alias, select your Subscription, select the Cosmo DB you created, select the Database you created, enter DeviceData for Collection Name, and click Save.
Task 2: Adjust the query for the device
Select Query.
Place your cursor at the end of line 14 and press Enter.
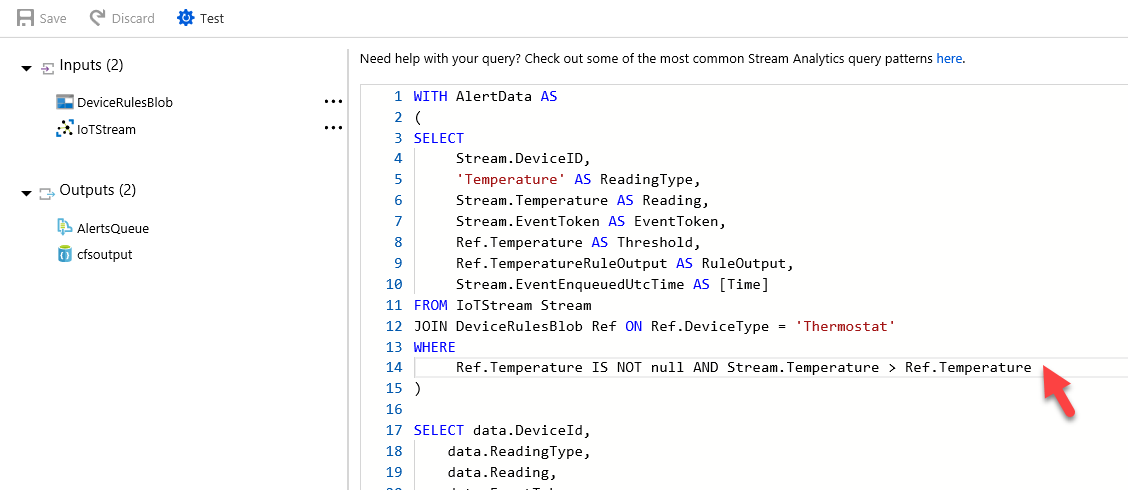
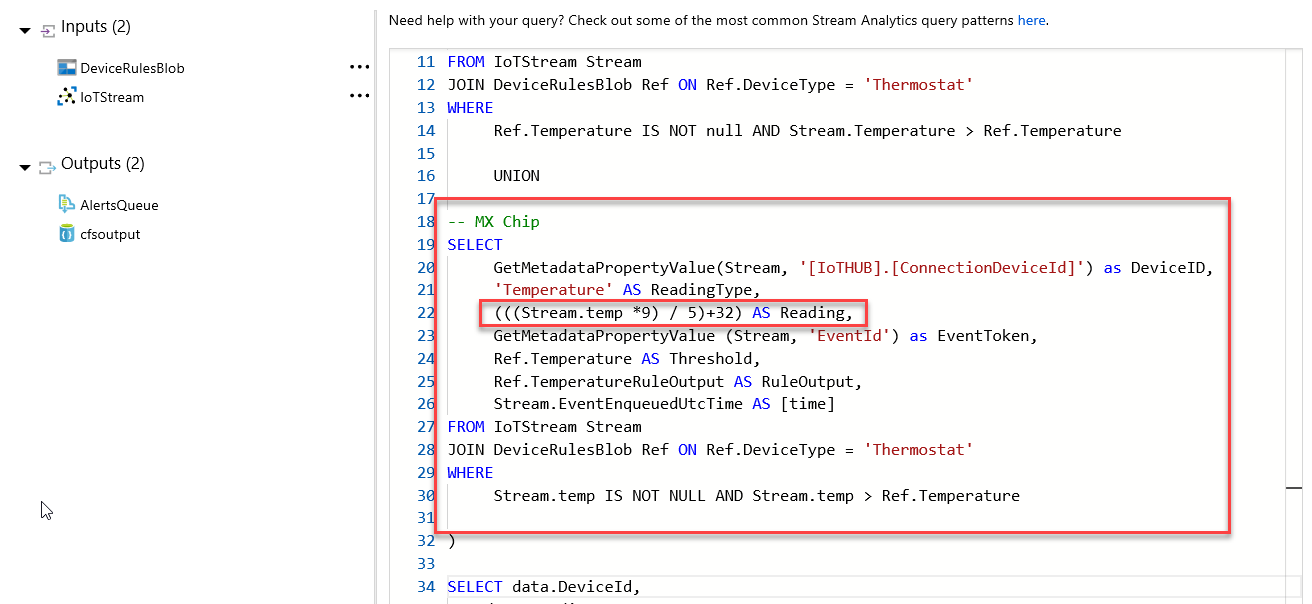
Paste the query snippet below. This will allow the query to support both the real and simulated devices.
UNION
-- MX Chip
SELECT
   GetMetadataPropertyValue(Stream, '[IoTHUB].[ConnectionDeviceId]') as DeviceID,
   'Temperature' AS ReadingType,
   (((Stream.temp *9) / 5)+32) AS Reading,
   GetMetadataPropertyValue (Stream, 'EventId') as EventToken,
   Ref.Temperature AS Threshold,
   Ref.TemperatureRuleOutput AS RuleOutput,
   Stream.EventEnqueuedUtcTime AS [time]
FROM IoTStream Stream
JOIN DeviceRulesBlob Ref ON Ref.DeviceType = 'Thermostat'
WHERE
   Stream.temp IS NOT NULL AND Stream.temp > Ref.Temperature
Notice that we are not only adjusting for field names but converting the temperature from Celsius to Fahrenheit.
Click Save Query.
Task 3: Add saved data to Azure Cosmos DB
Scroll down to the end of the query and add the below snippet to the Query. This will save a copy of the ingested data.
SELECT
IoTHub.ConnectionDeviceId as DeviceID, humidity, temp, pressure, magnetometerX, magnetometerY, magnetometerZ, accelerometerX, accelerometerY, accelerometerZ, gyroscopeX, gyroscopeY, gyroscopeZ INTO CosmosDB
FROM IoTStream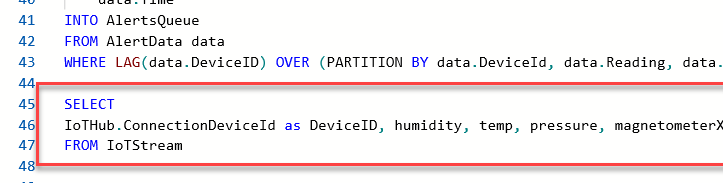
Click Save Query again.
Select Compatibility Level.
Change Compatibility Level to 1.2.
Select the Overview tab and restart the job.
Select Now and click Start.
Wait for the Stream Analytics Job to start.
Click on the Resource Group.
Open the Azure Cosmos DB you created.
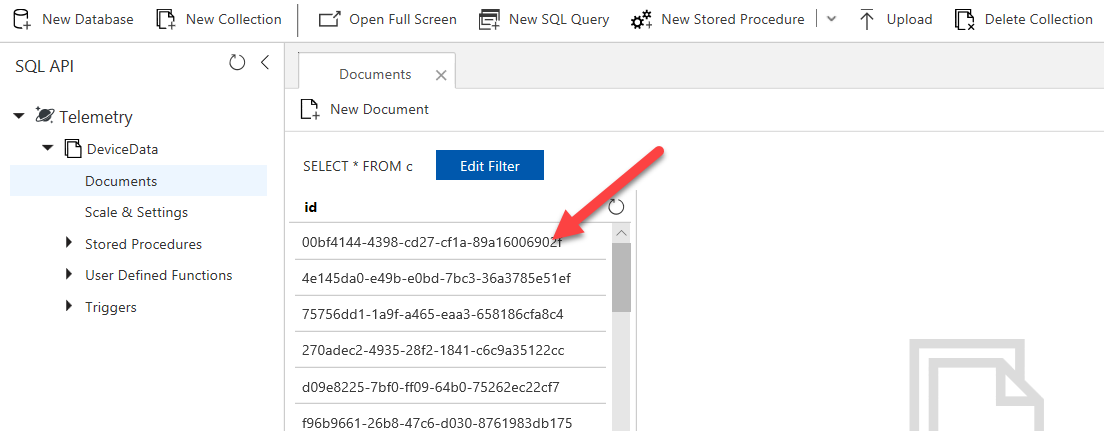
Select Data Explorer, expand Telemetry, expand DeviceData, and select Items.
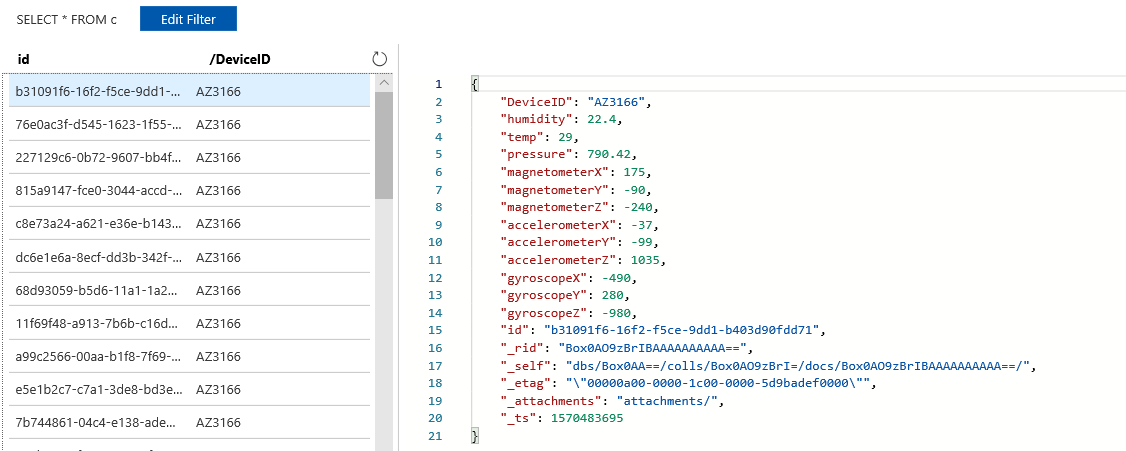
You should get list of documents. Click on one of the documents.
You should get sensor data from your device.
Exercise 4: Build new query
In this exercise, you will be building a new query to replace the existing Azure Stream Analytics job query. You will be building this new query incrementally, so you can see what the parts do. This lab is designed to work with your physical device, if you don't have a physical device you can alter the query to use fields from the simulated device.
Task 1: Add anomaly data collection to Azure
To save the detail scores generated from our anomaly detection we need to create another collection in the Azure Cosmos DB we used in the prior hands-on exercise. We are doing this to make it easy to see the values generated from the anomaly detection operator.
Go to your Azure portal, select Resource Groups and open the Resource Group you created when you deployed Connected Field Service.
Open the Azure Cosmo DB you created.
Select Data Explorer, click on the ... button of the Telemetry database and select New Container.
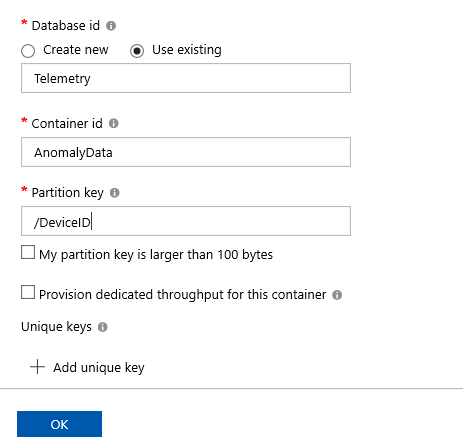
Enter AnomalyData for Container ID, enter DeviceID for Partition Key and click OK.
Task 2: Add new output
In this task, you will add a new Output for the AnomalyData container.
Close the Azure Cosmos DB blade.
Locate and open the Stream Analytics Job.
Click Stop. The Stream Analytics Job must be stopped before you can change its query and input/outputs.
Click Yes.
After the Job stops, select Output, click + Add, and select Cosmo DB.
Enter AnomalyDB for Output Alias, select your Subscription, select the Cosmo DB you created, select the Database you created, enter AnomalyData for Container Name, and click Save.
Task 3: Prepare and build the new query
Select Query.
Copy the existing query and save it in case you want to reference it later.
Clear the existing query, we are going to build a new one step by step.
Paste the below snippet in the Query editor.
WITH AlertData AS
(

SELECT
    IoTHub.ConnectionDeviceId as Device,
    System.Timestamp as tumblingWindowEnd,
       AVG(Stream.temp) as TempC,
       AVG(((Stream.temp*1.8)+32)) as TempF,
       AVG(Stream.accelerometerX) as accelerometerX,
       AVG(Stream.accelerometerY) as accelerometerY,
       AVG(Stream.accelerometerZ) as accelerometerZ

FROM
    IoTStream Stream TIMESTAMP BY IoTHub.EnqueuedTime
GROUP BY IoTHub.ConnectionDeviceId, TumblingWindow(second, 10)
),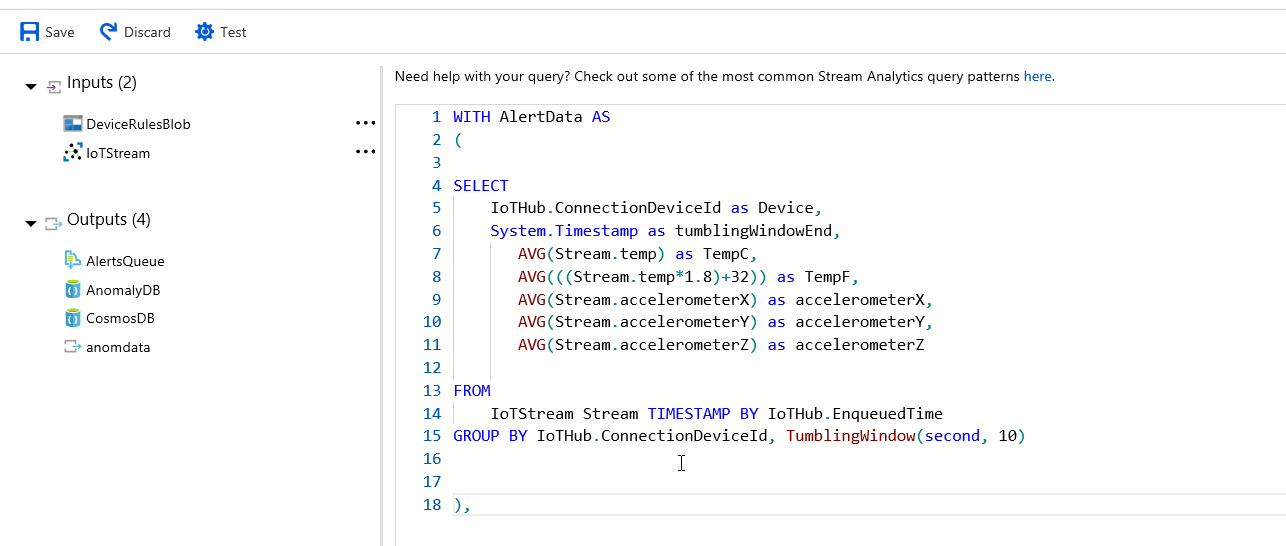
Note
This will process the raw data off the device and group into 10 second tumbling windows that will be evaluated for anomalies. We choose to use averages for the data in the window, you could use whatever aggregation that made since for your scenario.
Paste the following just after the prior query, this will use the data from the last query and further augment it.
FillInMissingValuesStep AS
    (
          SELECT
                System.Timestamp AS hoppingWindowEnd,
                TopOne() OVER (ORDER BY tumblingWindowEnd DESC) AS lastEvent
         FROM AlertData
         GROUP BY HOPPINGWINDOW(second, 300, 5)

    ),
Note
To help ensure uniformity of data so we don't have any gaps, we've chosen to fill the gaps by taking the last event in every hop window.
Paste the following step to do the actual anomaly scoring.
AnomalyDetectionStep AS (
SELECT
     lastevent.Device as lastEventDevice,
     hoppingWindowEnd,
                lastEvent.tumblingWindowEnd as lastTumblingWindowEnd,
                lastEvent.TempC as lastEventTempC,
                lastEvent.TempF as lastEventTempF,
                lastEvent.accelerometerY as lastEventaccelerometerY,
                lastEvent.accelerometerX as lastEventaccelerometerX,
                lastEvent.accelerometerZ as lastEventaccelerometerZ,
                system.timestamp as anomalyDetectionStepTimestamp,
     ANOMALYDETECTION(lastEvent.TempC) OVER (PARTITION BY lastevent.Device LIMIT DURATION(mi, 2)) as  scores
FROM FillInMissingValuesStep
),
Note
This query uses the ANOMALYDETECTION operator on the TempC value. It is done on each device and is measured over a two-minute duration. This causes training of the anomaly detection to be device specific and could accommodate for differences in baseline temperatures at each device location. The output from this results in scores being added to the output for evaluation in the next query.
Paste the following on to the query you are building.
AnomalyDetectionFilter AS (
SELECT lastEventDevice as DeviceId,
    CAST(GetRecordPropertyValue(scores, 'BiLevelChangeScore') as float) as BiLevelChangeScore,
    CAST(GetRecordPropertyValue(scores, 'SlowPosTrendScore') as float) as SlowPosTrendScore,
    CAST(GetRecordPropertyValue(scores, 'SlowNegTrendScore') as float) as SlowNegTrendScore,
    lastEventTempC as Reading,
    'Tempature' as ReadingType,
    'Trend Up ' as Threshold,
    'EventToken' as EventToken,
    lastTumblingWindowEnd as time

FROM AnomalyDetectionStep
WHERE
       CAST(GetRecordPropertyValue(scores, 'SlowPosTrendScore') as float) >= 10
union
SELECT lastEventDevice as DeviceId,
    CAST(GetRecordPropertyValue(scores, 'BiLevelChangeScore') as float) as BiLevelChangeScore,
    CAST(GetRecordPropertyValue(scores, 'SlowPosTrendScore') as float) as SlowPosTrendScore,
    CAST(GetRecordPropertyValue(scores, 'SlowNegTrendScore') as float) as SlowNegTrendScore,
    lastEventTempC as Reading,
    'Tempature' as ReadingType,
    'Trend Down ' as Threshold,
    'EventToken' as EventToken,
    lastTumblingWindowEnd as time

FROM AnomalyDetectionStep
WHERE
      CAST(GetRecordPropertyValue(scores, 'SlowNegTrendScore') as float) >= 10
)
Note
This does the evaluation of both the SlowPosTrendScore and SlowNegTrendScore. The value you are checking is the sensitivity. It could start being meaningful at 3.25, but we choose to wait till it was more significant at 10. In the real world you would tune that to your particular scenario. Note also we have fields selected for Reading, ReadingType, Threshold and EventToken. This is data that is expected by the Logic App for any message we output to the AlertsQueue which you will be doing in the next query. If you don't maintain these fields you need to modify that Logic App to not expect them.
Paste the snippet after the last snippet.
SELECT *
INTO AlertsQueue
FROM AnomalyDetectionFilter data
WHERE LAG(data.DeviceID) OVER (PARTITION BY data.DeviceId, CAST(data.Reading as bigint), data.ReadingType LIMIT DURATION(minute, 1)) IS NULL
Note
This does the actual insert into AlertsQueue which will be picked up by the Logic App to create the IoT Alert Record. Note we are keeping the LAG operator in the where to limit how often we put messages into the queue to only when the same device for a rounded temperature has new data within the minute.
To insure we log the same detail data from the device add back the following query.
SELECT
IoTHub.ConnectionDeviceId as DeviceID, humidity, temp, pressure, magnetometerX, magnetometerY, magnetometerZ, accelerometerX, accelerometerY, accelerometerZ, gyroscopeX, gyroscopeY, gyroscopeZ
Into CosmosDB
FROM IoTStream TIMESTAMP BY IoTHub.EnqueuedTime
Add the following, this will save off the scores from the anomaly detection operator, so you can easily see the data via the Azure Cosmos DB Data Explorer.
 SELECT
 lasteventdevice as DeviceID, hoppingwindowend, lasteventtempc, lasteventtempf, lasteventaccelerometery, lasteventaccelerometerx, lasteventaccelerometerz, anomalydetectionsteptimestamp, scores
 Into AnomalyDB
 FROM AnomalyDetectionStep
Save the Query.
Click Yes.
Select the Overview tab and click Start.
Select Now and click Start again.
Make sure the job stats successfully.
Exercise 5: Testing the query
In this exercise, you will attempt to cause the temperature on your physical device to be changed to test the anomaly detection.
Task 1: Test the query
Now is the challenging part, you need something to slowly change the temperature the device reads. Ice packs work well, as do cans of compressed air. A hair dryer or a hand warmer might work as well. Just make sure to protect your device so you don't get it wet or otherwise damage it.
Using one of the tools above, change the temperature of your device.
Close the Stream Analytics blade.
Open the Azure Cosmos DB.
Select Data Explorer, expand the AnomalyData, and select Items.
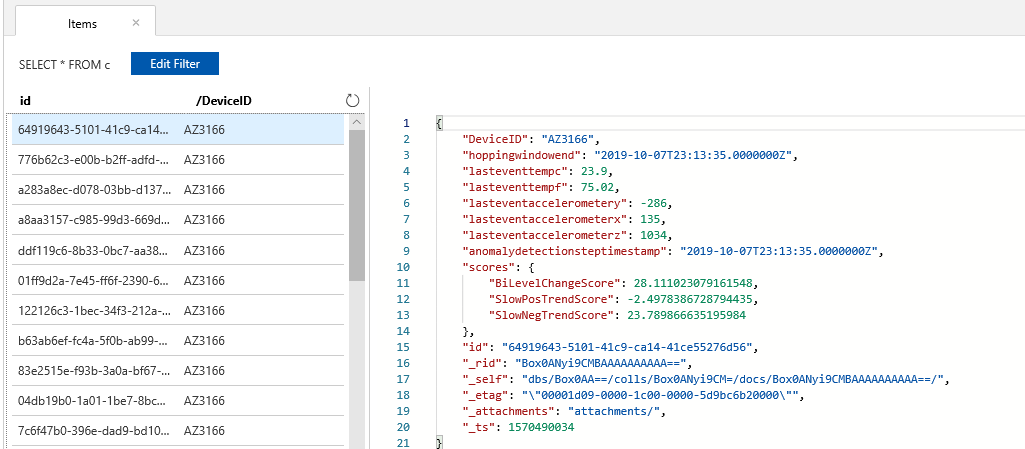
You should get list of alerts. Click on one of the alerts.
You should see sensor information from your device.
Navigate to Power Apps and make sure you are in the correct environment.
Select Apps and click to open the Connected Field Service application.
Select IoT Alerts.
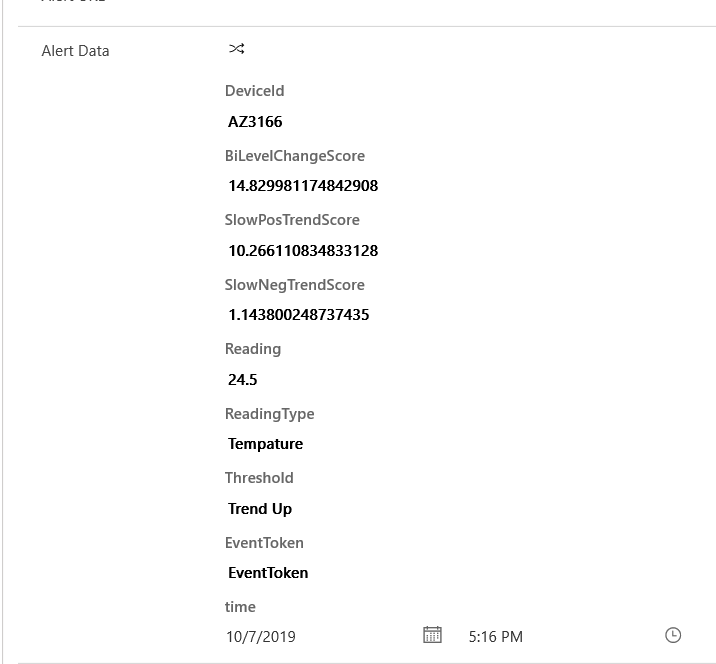
Open one of the alerts.
Go to the Alert Data section and you should see sensor information from your device.