Use Log Analytics
Start Log Analytics from the Azure portal by selecting Azure Monitor > Logs. You can also find this option in the menu for most Azure resources.
Wherever you start it from, it will be the same Log Analytics tool. However, the menu you use to start Log Analytics determines the data that will be available. If you start it from the Azure Monitor menu or the Log Analytics workspaces menu, you'll have access to all of the records in a workspace. If you select Logs from another type of resource, then your data will be limited to log data for that resource. See Log query scope and time range in Azure Monitor Log Analytics for details.

When you start Log Analytics, you'll see a dialog box containing example queries. These are categorized by solution, and you can browse or search for queries that match your requirements. You may be able to find one that does exactly what you need, or load one into the editor and modify it as required. Browsing through example queries is a great way to learn how to write your own queries.
Note
If you want to start with an empty script and write it yourself, you can close the example queries. Click Queries at the top of the screen if you want to get them back.
Azure Monitor Logs is based on Azure Data Explorer, and log queries are written using the same Kusto Query Language (KQL). This is a rich language designed to be easy to read and author, so you should be able to start writing queries with some basic guidance.
At its core, a Kusto query is a read-only request. The request processes data, and then returns results in easy-to-read plain text. Each query uses schema entities that are organized into a hierarchy similar to SQL: databases, tables, and columns. A query consists of references to actual tables and one or more query operators applied in sequence. You'll mostly interact with and query monitoring data using tabular operators such as count, distinct, evaluate, join, limit, and project.
Log Analytics is the primary tool in the Azure portal for editing log queries and interactively analyzing their results. Even if you intend to use a log query elsewhere in Azure Monitor, you'll typically write and test it in Log Analytics before copying it to its final location.
Log alert rules proactively identify issues from data in your workspace. Each alert rule is based on a log query that is automatically run at regular intervals. The results are inspected to determine if an alert should be created.
Workbooks include the results of log queries using different visualizations in interactive visual reports in the Azure portal.
Log Analytics interface
The following image identifies the different components of Log Analytics with the numbers listed below.
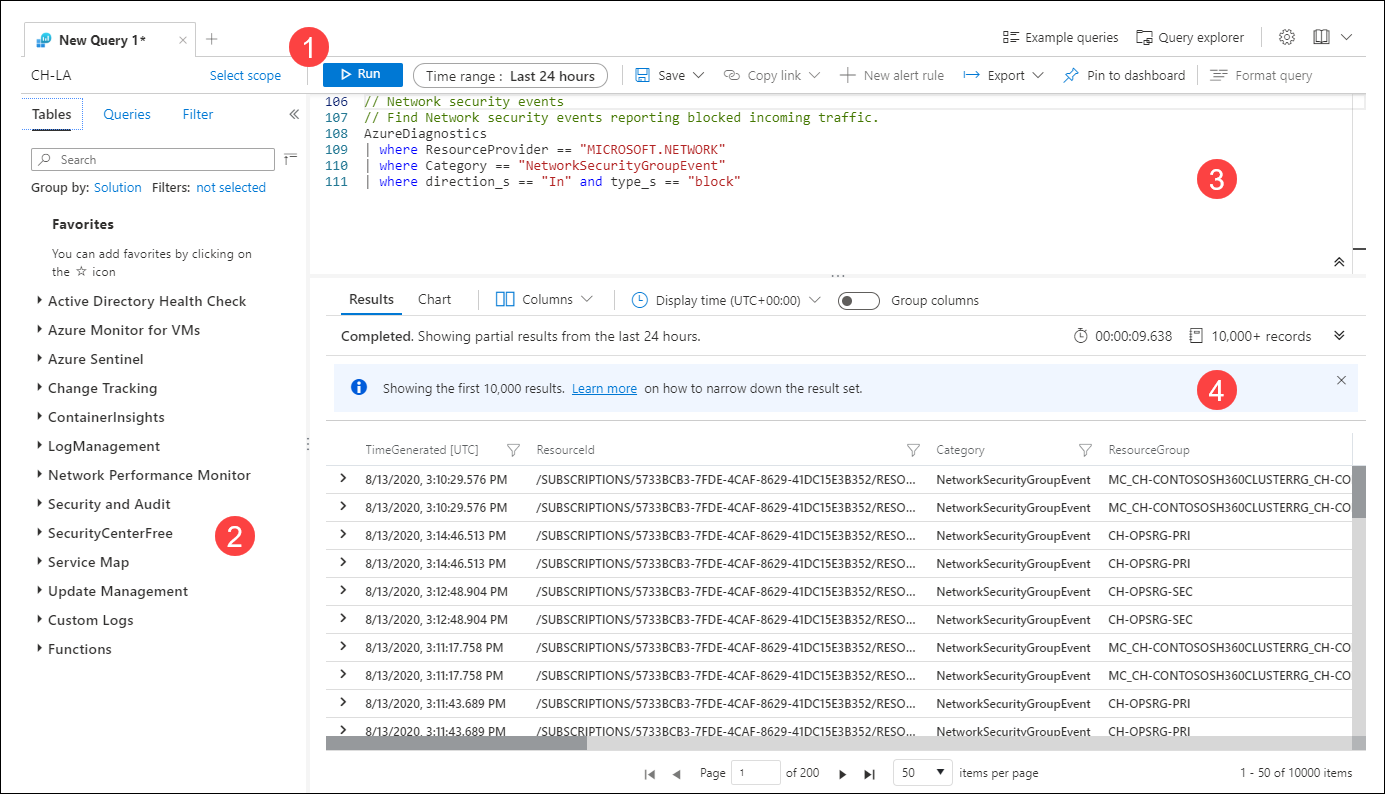
1. Top action bar
The top action bar contains controls for working with the query in the query window. These include:
- Scope
- Run button
- Time picker
- New alert rule button
- Export button
- Format query button
2. Sidebar
The sidebar displays lists of tables in the workspace, sample queries, and filter options for the current query.
3. Query window
The query window is where you edit your query. This includes intellisense for KQL commands and color coding to enhance readability. Click the + at the top of the window to open another tab.
A single window can include multiple queries. A query cannot include any blank lines, so you can separate multiple queries in a window with one or more blank lines. The current query is the one with the cursor positioned anywhere in it.
To run the current query, click the Run button or press Shift+Enter.
4. Results window
The results of the query are displayed in the results window. By default, the results are displayed as a table. To display as a chart, either select Chart in the results window, or add a render command to your query.
The Results view displays query results in a table organized by columns and rows.
The Chart view displays the results as one of multiple available chart types.
For more in-depth learning see:
Log Analytics tutorial: Log Analytics is the tool that you'll use in the Azure portal to edit and run queries. It also allows you to write simple queries without directly working with the query language. If you haven't used Log Analytics before, start here so you understand the tool that you'll use with the other tutorials and samples.
KQL tutorial: Guided walkthrough of basic KQL concepts and common operators. This is an excellence introduction to the language itself and the structure of log queries.
Example queries: Description of the example queries available in Log Analytics. You can use the queries without modification or use them as samples to learn KQL.
Query samples: Sample queries illustrating a variety of different concepts.