Explore Azure Monitor and Log Analytics
When you run at cloud scale, you need intelligent logging and monitoring tools that scale to your needs and provide real-time insight into your data. Traditional monitoring approaches that work for a few servers break down when managing hundreds or thousands of resources across multiple regions.
Understanding Azure Monitor and Log Analytics
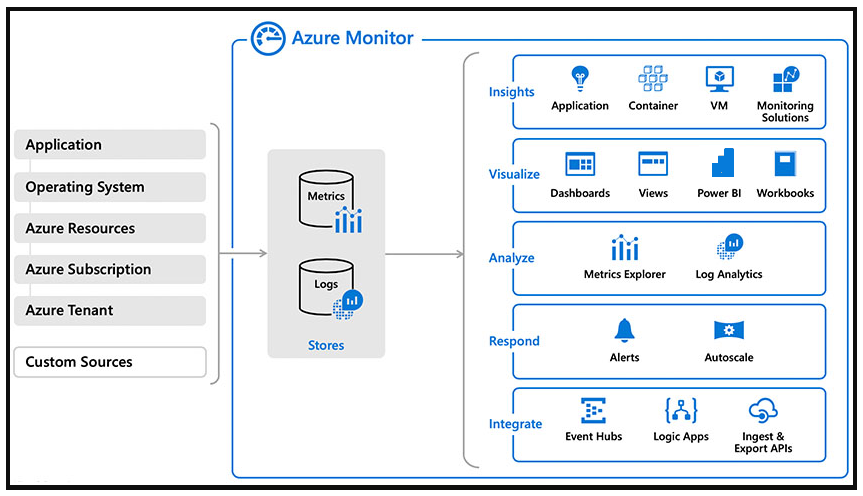
Azure Monitor is Microsoft's native cloud monitoring solution that provides comprehensive observability across your entire estate. Azure Monitor collects monitoring telemetry from different kinds of on-premises and Azure sources, creating a unified view of your infrastructure and applications regardless of where they run.
Azure Monitor architecture and capabilities
Data collection sources:
- Azure resources: Platform metrics, resource logs, activity logs
- Applications: Application Insights SDK telemetry
- Virtual machines: Performance counters, event logs, syslog
- Containers: Container logs, Kubernetes metrics
- Custom sources: REST API, Data Collector API, custom agents
Management tool integrations:
Azure Monitor provides management tools integration, such as those in Azure Security Center and Azure Automation, enabling ingestion of custom log data to Azure:
- Azure Security Center: Security alerts and recommendations flow into Azure Monitor
- Azure Automation: Runbook execution logs and automation telemetry
- Azure Backup: Backup job status and recovery point information
- Azure Site Recovery: Replication health and failover events
- Third-party tools: SIEM integrations, ITSM connectors, custom applications
The Log Analytics data store
The service aggregates and stores this telemetry in a log data store optimized for cost and performance. Unlike traditional databases designed for transactional workloads, Log Analytics is specifically built for:
Performance characteristics:
- Fast ingestion: Handle billions of events per day across thousands of sources
- Efficient storage: Columnar compression reduces storage costs by 90% or more
- Query speed: Execute complex analytics across terabytes in seconds
- Scalability: Automatically scale to handle workload variations
- Retention flexibility: Configure different retention periods by table (30 days to 12 years)
Cost optimization features:
- Data tiers: Basic Logs (low-cost, limited queries) vs Analytics Logs (full query capability)
- Commitment tiers: Discounts for predictable ingestion volumes
- Archiving: Move old data to low-cost archive storage
- Data collection rules: Filter data before ingestion to reduce costs
Capabilities of Azure Monitor
With Azure Monitor, you can analyze data, set up alerts, and get end-to-end views of your applications. The platform uses machine-learning-driven insights to identify and resolve problems quickly:
Analysis capabilities:
- Log Analytics queries: Use Kusto Query Language (KQL) to analyze telemetry
- Workbooks: Create interactive reports combining queries and visualizations
- Dashboards: Pin important metrics and queries to shared dashboards
- Power BI integration: Export data to Power BI for advanced reporting
Alerting capabilities:
- Metric alerts: Trigger on threshold violations or anomalies
- Log alerts: Fire when query results meet conditions
- Activity log alerts: Notify on Azure resource operations
- Smart detection: Automatically identify abnormal patterns
Insights capabilities:
- Application Insights: APM with distributed tracing and profiling
- Container Insights: Kubernetes cluster health and performance
- VM Insights: Virtual machine dependencies and process monitoring
- Network Insights: Network topology and connectivity analysis
Machine learning features:
- Anomaly detection: Automatically identify unusual metric patterns
- Root cause analysis: Suggest likely causes for performance issues
- Smart groups: Cluster related alerts to reduce noise
- Predictive analytics: Forecast resource utilization trends
What you'll learn in this hands-on tutorial
In this tutorial, we focus on the Log Analytics part of Azure Monitor—the powerful log aggregation and analysis engine that enables deep investigation of telemetry data. This hands-on exercise walks through the complete setup and configuration process.
Learning objectives
By the end of this tutorial, you'll be able to:
1. Set up Log Analytics workspace:
- Create a workspace using PowerShell automation
- Configure intelligence packs (solutions) for specialized monitoring
- Enable IIS log collection for web server monitoring
- Configure Windows event log collection
- Understand workspace security keys and access management
2. Connect virtual machines to a Log Analytics workspace:
- Install the Microsoft Monitoring Agent extension on VMs
- Configure the workspace connection with secure keys
- Troubleshoot extension installation issues
- Understand agent communication and data flow
- Manage multi-workspace scenarios
3. Configure Log Analytics workspace to collect custom performance counters:
- Define performance counter collection rules
- Set sampling intervals for different counter types
- Configure instance-specific vs. aggregate collection
- Create SQL Server-specific monitoring configurations
- Optimize counter collection to balance detail and cost
4. Analyze telemetry using Kusto Query Language (KQL):
- Query collected performance data
- Correlate events across different sources
- Create visualizations from query results
- Build alerts based on query conditions
5. Generate and observe test data:
- Use load testing tools to simulate realistic workloads
- Observe performance counter behavior under load
- Correlate load patterns with collected telemetry
- Understand latency between event occurrence and availability in logs
Getting started
Prerequisites
Before beginning this tutorial, ensure you have:
Azure resources:
- Active Azure subscription: With permissions to create resources
- Resource group: Existing group or ability to create one
- Virtual machine: One or more Windows VMs with RDP access
- PowerShell access: Azure Cloud Shell or local Azure PowerShell module
Access requirements:
- Contributor role: On the resource group to create Log Analytics workspace
- VM Contributor role: To install extensions on virtual machines
- RDP access: To the VM for validating agent installation and generating test load
If you don't have these prerequisites:
- Create a new resource group and virtual machine in the Azure portal
- Use a Windows Server 2019 or later VM with at least 2 cores and 4 GB RAM
- Ensure the VM is running and accessible via RDP
Understanding the setup process
This tutorial uses PowerShell automation to configure monitoring, demonstrating Infrastructure as Code (IaC) principles:
Benefits of PowerShell automation:
- Repeatability: Same script works across multiple environments
- Documentation: Script serves as documentation of configuration
- Version control: Store scripts in source control for tracking changes
- Consistency: Eliminates manual configuration errors
- Scale: Apply configuration to dozens of VMs with minimal effort
Step 1: Create Log Analytics workspace
Log into Azure Cloud Shell and execute the following script. This script creates a new resource group and Log Analytics workspace, then configures multiple monitoring solutions.
Important: Record the WorkspaceId from the output—you'll use it in subsequent steps to connect VMs to the workspace.
Before running: Replace the values of the variables with your environment-specific information:
$ResourceGroup: Your resource group name (e.g., "azwe-rg-devtest-logs-001")$WorkspaceName: Unique workspace name (e.g., "azwe-devtest-logs-01")$Location: Azure region (e.g., "westeurope", "eastus", "westus2")
What this script does:
Creates or verifies resource group: Checks if the resource group exists; creates it if needed
Creates Log Analytics workspace: Deploys the central telemetry collection workspace
Installs intelligence packs: Adds monitoring solutions for capacity, logs, change tracking, and processes
Enables IIS log collection: Configures collection of web server logs
Configures Windows event logs: Sets up collection of Application event log errors and warnings
$ResourceGroup = "azwe-rg-devtest-logs-001"
$WorkspaceName = "azwe-devtest-logs-01"
$Location = "westeurope"

# List of solutions to enable
$Solutions = "CapacityPerformance", "LogManagement", "ChangeTracking", "ProcessInvestigator"

# Create the resource group if needed
try {
    Get-AzResourceGroup -Name $ResourceGroup -ErrorAction Stop
} catch {
    New-AzResourceGroup -Name $ResourceGroup -Location $Location
}

# Create the workspace
New-AzOperationalInsightsWorkspace -Location $Location -Name $WorkspaceName -ResourceGroupName $ResourceGroup

# List all solutions and their installation status
Get-AzOperationalInsightsIntelligencePacks -ResourceGroupName $ResourceGroup -WorkspaceName $WorkspaceName

# Add solutions
foreach ($solution in $Solutions) {
    Set-AzOperationalInsightsIntelligencePack -ResourceGroupName $ResourceGroup -WorkspaceName $WorkspaceName -IntelligencePackName $solution -Enabled $true
}

# List enabled solutions
(Get-AzOperationalInsightsIntelligencePacks -ResourceGroupName $ResourceGroup -WorkspaceName $WorkspaceName).Where({($_.enabled -eq $true)})

# Enable IIS Log Collection using the agent
Enable-AzOperationalInsightsIISLogCollection -ResourceGroupName $ResourceGroup -WorkspaceName $WorkspaceName

# Windows Event
New-AzOperationalInsightsWindowsEventDataSource -ResourceGroupName $ResourceGroup -WorkspaceName $WorkspaceName -EventLogName "Application" -CollectErrors -CollectWarnings -Name "Example Application Event Log"
Step 2: Retrieve workspace keys
Retrieve the Log Analytics workspace secure key. This key authenticates agents connecting to the workspace and should be protected as a secret.
What is the workspace key?
- Authentication credential: Proves agent is authorized to send data to the workspace
- Shared secret: Used by all agents connecting to this workspace
- Security consideration: Should be rotated periodically and stored securely
- Regeneration: Can be regenerated if compromised (requires re-configuring all agents)
Replace the values of the variables with your existing resource group and workspace name:
Get-AzOperationalInsightsWorkspaceSharedKey `
                    -ResourceGroupName azwe-rg-devtest-logs-001 `
                    -Name azwe-devtest-logs-01
Step 3: Connect VMs to Log Analytics workspace
Map existing virtual machines with the Log Analytics workspace. This script installs the Microsoft Monitoring Agent (MMA) extension onto an existing VM, enabling it to send telemetry to the workspace.
What is the Microsoft Monitoring Agent?
- Data collection agent: Runs on the VM as a Windows service
- Performance counter collection: Gathers CPU, memory, disk, network metrics
- Event log forwarding: Sends Windows event logs to the workspace
- IIS log collection: Captures web server access and error logs
- Secure transmission: Encrypted communication with the workspace
- Local buffering: Stores data locally if connectivity is lost
Extension vs. standalone agent:
- Extension: Deployed and managed through Azure Resource Manager
- Automatic updates: Azure can push agent updates
- Simplified deployment: No need to RDP into VMs
- Lifecycle management: Agent is tied to VM lifecycle
Note
Replace the values of the variables with your specific environment information:
$ResourceGroupName: Resource group containing the VM$VMName: Name of the virtual machine to monitor$Location: Azure region where the VM is located$PublicSettings["workspaceId"]: WorkspaceId retrieved in Step 1$ProtectedSettings["workspaceKey"]: Workspace key retrieved in Step 2
$PublicSettings = @{"workspaceId" = "<myWorkspaceId>"}
$ProtectedSettings = @{"workspaceKey" = "<myWorkspaceKey>"}
$ResourceGroupName = "azwe-rg-devtest-logs-001"
$VMName = "azsu-d-sql01-01"
$Location = "westeurope"

Set-AzVMExtension -ExtensionName "Microsoft.EnterpriseCloud.Monitoring" `
    -ResourceGroupName $ResourceGroupName `
    -VMName $VMName `
    -Publisher "Microsoft.EnterpriseCloud.Monitoring" `
    -ExtensionType "MicrosoftMonitoringAgent" `
    -TypeHandlerVersion 1.0 `
    -Settings $PublicSettings `
    -ProtectedSettings $ProtectedSettings `
    -Location $Location
Note
If you have multiple subscriptions, you may need to set the subscription context before running the above command. Use the following command to set the subscription context.
Set-AzContext -SubscriptionId "<subscription-id>"
Note
If the extension fails to install, try to remove the extension and re-install it. Use the following command to remove the extension.
 Remove-AzVMExtension -ResourceGroupName $ResourceGroupName -VMName $VMName -Name "Microsoft.EnterpriseCloud.Monitoring"

 Set-AzVMExtension -ExtensionName "Microsoft.EnterpriseCloud.Monitoring" `
 -ResourceGroupName $ResourceGroupName `
 -VMName $VMName `
 -Publisher "Microsoft.EnterpriseCloud.Monitoring" `
 -ExtensionType "MicrosoftMonitoringAgent" `
 -TypeHandlerVersion 1.0 `
 -Settings $PublicSettings `
 -ProtectedSettings $ProtectedSettings `
 -Location $Location
Note
If it still fails, check the VM's event logs for any errors, or install the extension manually by downloading the Microsoft Monitoring Agent and running the installer.
Step 4: Configure performance counter collection
Run the script below to configure performance counters to be collected from connected virtual machines. This script adds dozens of performance counters covering system, network, and SQL Server metrics.
What are performance counters?
- Windows Performance Monitor metrics: Same counters available in
perfmon.msc - Real-time measurements: CPU usage, memory consumption, disk I/O, network throughput
- Application-specific: SQL Server, IIS, .NET CLR, and other application counters
- Sampling interval: How frequently to collect each counter (10 seconds in this example)
- Instance selection: Collect from all instances (
*) or specific instances (_Total)
Performance counter categories in this script:
| Category | Examples | Use Case |
|---|---|---|
| System | Processor Queue Length | Overall system health |
| Processor | % Processor Time | CPU utilization per core |
| Memory | Available MBytes, Page Faults/sec | Memory pressure detection |
| LogicalDisk | Disk Transfers/sec, Avg. Disk sec/Read | Disk I/O performance |
| Network | Bytes Received/sec, Bytes Sent/sec | Network throughput |
| Process | % Processor Time | Per-process resource usage |
| SQL Agent | Activated alerts, Failed jobs | SQL Server agent health |
| SQL Server | Lock escalations, Deadlocks/sec | Database performance |
Collection interval considerations:
- 10 seconds: High resolution for troubleshooting (higher cost)
- 60 seconds: Standard interval for operational monitoring (balanced)
- 300 seconds (5 minutes): Low resolution for capacity planning (lower cost)
Before running, replace azwe-rg-devtest-logs-001 and azwe-devtest-logs-01 with your resource group and workspace name in the script:
#Login-AzureRmAccount

#Instance
##################################
$InstanceNameAll = "*"
$InstanceNameTotal = '_Total'
#Objects
##################################
$ObjectCache = "Cache"
$ObjectLogicalDisk = "LogicalDisk"
$ObjectMemory = "Memory"
$ObjectNetworkAdapter = "Network Adapter"
$ObjectNetworkInterface = "Network Interface"
$ObjectPagingFile = "Paging File"
$ObjectProcess = "Process"
$ObjectProcessorInformation = "Processor Information"
$ObjectProcessor = "Processor"

$ObjectSQLAgentAlerts = "SQLAgent:Alerts"
$ObjectSQLAgentJobs = "SQLAgent:Jobs"
$ObjectSQLAgentStatistics = "SQLAgent:Statistics"

$ObjectSQLServerAccessMethods = "SQLServer:Access Methods"
$ObjectSQLServerExecStatistics = "SQLServer:Exec Statistics"
$ObjectSQLServerLocks = "SQLServer:Locks"
$ObjectSQLServerSQLErrors = "SQLServer:SQL Errors"

$ObjectSystem = "System"

#Counters
#########################################################
$CounterCache = "Copy Read Hits %"

$CounterLogicalDisk =
    "% Free Space" `
    ,"Avg. Disk sec/Read" `
    ,"Avg. Disk sec/Transfer" `
    ,"Avg. Disk sec/Write" `
    ,"Current Disk Queue Length" `
    ,"Disk Read Bytes/sec" `
    ,"Disk Reads/sec" `
    ,"Disk Transfers/sec" `
    ,"Disk Writes/sec"

$CounterMemory =
    "% Committed Bytes In Use" `
    ,"Available MBytes" `
    ,"Page Faults/sec" `
    ,"Pages Input/sec" `
    ,"Pages Output/sec" `
    ,"Pool Nonpaged Bytes"

$CounterNetworkAdapter =
    "Bytes Received/sec" `
    ,"Bytes Sent/sec"

$CounterNetworkInterface = "Bytes Total/sec"

$CounterPagingFile =
    "% Usage" `
    ,"% Usage Peak"

$CounterProcess = "% Processor Time"

$CounterProcessorInformation =
    "% Interrupt Time" `
    ,"Interrupts/sec"

$CounterProcessor = "% Processor Time"
$CounterProcessorTotal = "% Processor Time"

$CounterSQLAgentAlerts = "Activated alerts"
$CounterSQLAgentJobs = "Failed jobs"
$CounterSQLAgentStatistics = "SQL Server restarted"
$CounterSQLServerAccessMethods = "Table Lock Escalations/sec"
$CounterSQLServerExecStatistics = "Distributed Query"
$CounterSQLServerLocks = "Number of Deadlocks/sec"
$CounterSQLServerSQLErrors = "Errors/sec"

$CounterSystem = "Processor Queue Length"

#########################################################
$global:number = 1 #Name parameter needs to be unique that why we'll use number ++ in function
#########################################################

function AddPerfCounters ($PerfObject, $PerfCounters, $Instance)
{
    ForEach ($Counter in $PerfCounters)
    {
        New-AzOperationalInsightsWindowsPerformanceCounterDataSource `
                    -ResourceGroupName 'azwe-rg-devtest-logs-001' `
                    -WorkspaceName 'azwe-devtest-logs-01' `
                    -ObjectName $PerfObject `
                    -InstanceName $Instance `
                    -CounterName $Counter `
                    -IntervalSeconds 10 `
                    -Name "Windows Performance Counter $global:number"
        $global:number ++
    }
}

AddPerfCounters -PerfObject $ObjectLogicalDisk -PerfCounter $CounterLogicalDisk -Instance $InstanceNameAll
AddPerfCounters -PerfObject $ObjectNetworkAdapter -PerfCounter $CounterNetworkAdapter -Instance $InstanceNameAll
AddPerfCounters -PerfObject $ObjectNetworkInterface -PerfCounter $CounterNetworkInterface -Instance $InstanceNameAll
AddPerfCounters -PerfObject $ObjectPagingFile -PerfCounter $CounterPagingFile -Instance $InstanceNameAll
AddPerfCounters -PerfObject $ObjectProcess -PerfCounter $CounterProcess -Instance $InstanceNameAll
AddPerfCounters -PerfObject $ObjectProcessorInformation -PerfCounter $CounterProcessorInformation -Instance $InstanceNameAll
AddPerfCounters -PerfObject $ObjectProcessor -PerfCounter $CounterProcessor -Instance $InstanceNameAll
AddPerfCounters -PerfObject $ObjectProcessor -PerfCounter $CounterProcessorTotal -Instance $InstanceNameTotal
AddPerfCounters -PerfObject $ObjectSQLAgentAlerts -PerfCounter $CounterSQLAgentAlerts -Instance $InstanceNameAll
AddPerfCounters -PerfObject $ObjectSQLAgentJobs -PerfCounter $CounterSQLAgentJobs -Instance $InstanceNameAll
AddPerfCounters -PerfObject $ObjectSQLAgentStatistics -PerfCounter $CounterSQLAgentStatistics -Instance $InstanceNameAll
AddPerfCounters -PerfObject $ObjectSQLServerAccessMethods -PerfCounter $CounterSQLServerAccessMethods -Instance $InstanceNameAll
AddPerfCounters -PerfObject $ObjectSQLServerExecStatistics -PerfCounter $CounterSQLServerExecStatistics -Instance $InstanceNameAll
AddPerfCounters -PerfObject $ObjectSQLServerLocks -PerfCounter $CounterSQLServerLocks -Instance $InstanceNameAll
AddPerfCounters -PerfObject $ObjectSQLServerSQLErrors -PerfCounter $CounterSQLServerSQLErrors -Instance $InstanceNameAll
AddPerfCounters -PerfObject $ObjectSystem -PerfCounter $CounterSystem -Instance $InstanceNameAll
AddPerfCounters -PerfObject $ObjectMemory -PerfCounter $CounterMemory -Instance $InstanceNameAll
AddPerfCounters -PerfObject $ObjectCache -PerfCounter $CounterCache -Instance $InstanceNameAll
Step 5: Generate test data
To generate performance statistics for observation in Log Analytics, download the HeavyLoad utility (a free load testing utility) and run it on the virtual machine to simulate high CPU, memory, and IOPS consumption.
Why generate test load?
- Validate monitoring: Confirm that performance counters are being collected
- Observe correlation: See how different metrics correlate under load
- Test alerting: Verify that alerts fire when thresholds are exceeded
- Understand baseline: Compare loaded vs. unloaded performance
- Practice investigation: Use realistic data for learning KQL queries
HeavyLoad capabilities:
- CPU stress: Configure number of threads and target utilization percentage
- Memory allocation: Allocate and fill specified amount of RAM
- Disk I/O: Generate read/write operations to stress disk subsystem
- Network stress: Generate network traffic to test bandwidth
- Configurable duration: Run for specific time period or continuously
Recommended test procedure:
- RDP into the VM: Connect to the virtual machine
- Download HeavyLoad: Visit jam-software.com/heavyload and download the tool
- Run baseline collection: Wait 5-10 minutes with no load to establish baseline
- Start moderate load: CPU 50%, Memory 50% for 5 minutes
- Increase load: CPU 80%, Memory 70% for 5 minutes
- Run heavy load: CPU 95%, Memory 85% for 5 minutes
- Stop load: Allow system to return to baseline for 5-10 minutes
- Query data: Return to Azure portal after 10-15 minutes (data latency) to query results
Data ingestion latency:
- Typical latency: 5-10 minutes from event occurrence to queryability
- Can be longer: During high volume periods, up to 15 minutes
- Use timestamp: Query by event timestamp (TimeGenerated), not ingestion time
How it works
Understanding the data flow from the virtual machine to Log Analytics helps troubleshoot issues and optimize configurations.
Microsoft Monitoring Agent architecture
Log Analytics works by running the Microsoft Monitoring Agent service on the machine. The agent architecture includes several components working together:
1. Data collection:
- Performance counter collector: Samples metrics at configured intervals
- Event log reader: Monitors Windows event logs for new entries
- IIS log parser: Processes web server logs
- Custom data sources: Collects user-defined logs and metrics
2. Local processing:
- Filtering: Apply collection rules to determine what data to send
- Parsing: Extract structured data from unstructured logs
- Enrichment: Add context (computer name, timestamp, resource ID)
- Buffering: Store events locally in case of network issues
3. Secure transmission:
- TLS encryption: All data encrypted in transit using TLS 1.2+
- Authentication: Workspace ID and key authenticate the agent
- Compression: Reduce bandwidth by compressing data
- Batching: Send multiple events together for efficiency
4. Reliability features:
- Local buffer: 10 GB disk buffer for storing events during outages
- Automatic retry: Retry failed transmissions with exponential backoff
- Health monitoring: Agent reports its own health status
- Automatic recovery: Restart service if it crashes
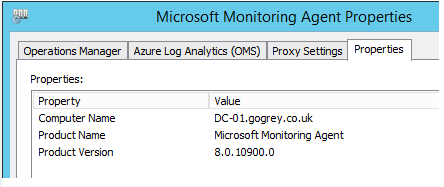
Validating agent configuration
To verify agent installation and configuration:
- Log in to the virtual machine via RDP
- Navigate to
C:\Program Files\Microsoft Monitoring Agent\MMA - Open the agent control panel (
control panel.exe Microsoft Monitoring Agent) - Review the Azure Log Analytics tab showing:
- Connected workspaces: Workspace ID and connection status
- Computer name: How the VM is identified in logs
- Agent version: Current MMA version installed
- Last heartbeat: When agent last communicated with the workspace
Multi-workspace capability
You can add multiple Log Analytics workspaces to publish the log data into various workspaces. This is useful for:
Centralized and delegated monitoring:
- Central IT workspace: All VMs report to a central workspace for overall visibility
- Application team workspace: Same VMs also report to application-specific workspaces
- Security workspace: Security logs sent to a separate SIEM-integrated workspace
Multi-tenant scenarios:
- Managed service provider: Customer VMs report to both MSP and customer workspaces
- Cost allocation: Separate workspaces for accurate usage tracking per business unit
Compliance requirements:
- Regional data residency: Different workspaces in different regions for regulatory compliance
- Retention policies: Send security logs to long-retention workspace, operational logs to short-retention
Considerations for multi-workspace:
- Increased cost: Data ingestion charged in each workspace
- Agent overhead: Additional CPU and network for sending to multiple destinations
- Configuration complexity: Maintain consistent collection rules across workspaces
Summary
What you've accomplished
By completing this hands-on tutorial, you've built a complete Log Analytics monitoring solution:
Infrastructure setup:
- Created a Log Analytics workspace in a resource group with appropriate naming conventions
- Configured intelligence packs (solutions) for specialized monitoring scenarios
- Enabled multiple data sources including IIS logs and Windows event logs
- Retrieved workspace keys for secure agent authentication
Agent deployment:
- Installed the Microsoft Monitoring Agent extension on a virtual machine using PowerShell automation
- Configured secure workspace connection using workspace ID and key
- Validated agent installation through the agent control panel
- Understood multi-workspace capabilities for complex scenarios
Data collection configuration:
- Configured comprehensive performance counter collection covering:
- System metrics (CPU, memory, disk, network)
- Application metrics (SQL Server, IIS)
- Process-level monitoring
- Set sampling intervals appropriate for monitoring needs (10-second intervals for detailed analysis)
- Automated configuration using PowerShell scripts for repeatability
Testing and validation:
- Generated realistic test data using HeavyLoad utility to simulate production workloads
- Stressed multiple system components (CPU, memory, IOPS) to observe monitoring behavior
- Understood data ingestion latency (5-15 minutes from event to queryability)
- Prepared for analysis with performance data ready to query in subsequent units
Next steps
Now that data is flowing into Log Analytics, the next unit covers Kusto Query Language (KQL)—the powerful query language used to analyze this telemetry and extract actionable insights.
You'll learn to:
- Write KQL queries to filter and analyze performance data
- Create visualizations from query results
- Identify performance bottlenecks using the collected metrics
- Build alerts based on query conditions
- Create dashboards for real-time monitoring
Key takeaways
Infrastructure as Code approach:
- All configuration performed via PowerShell scripts
- Scripts can be version controlled and reused
- Automation eliminates manual configuration errors
- Same scripts work across dev, test, and production
Agent-based monitoring:
- Microsoft Monitoring Agent runs as a Windows service
- Local buffering ensures data isn't lost during outages
- Secure encrypted communication protects telemetry
- Multi-workspace capability supports complex organizational structures
Performance counter collection:
- Hundreds of counters available for monitoring
- Sampling interval balances detail vs. cost
- Instance selection allows granular or aggregate collection
- Application-specific counters (SQL Server, IIS) provide deep insights
Data latency considerations:
- Typical 5-10 minute delay from event to queryability
- Use TimeGenerated field for event occurrence time
- Local buffering handles temporary connectivity issues
- Plan alerting and analysis workflows accounting for this latency