Explore Application Insights
Application Insights is Azure's Application Performance Monitoring (APM) solution that provides deep insights into how your applications perform and how users interact with them. Unlike infrastructure monitoring (covered in previous units), Application Insights focuses on application-level telemetry—requests, dependencies, exceptions, and custom business events.
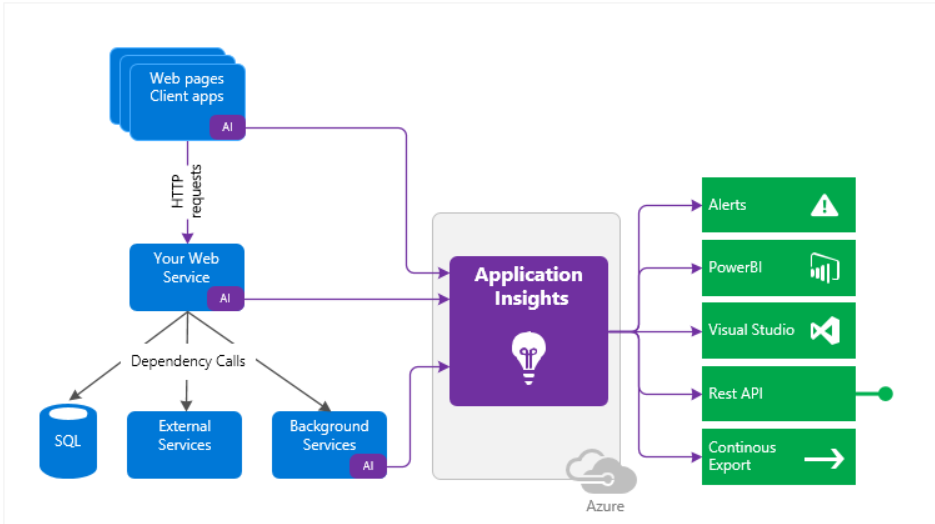
How Application Insights works
Installation and setup
You install a small instrumentation package in your application and set up an Application Insights resource in the Microsoft Azure portal. The setup process varies by platform but generally involves:
1. Create Application Insights resource:
- Navigate to Azure portal and create an Application Insights resource
- Obtain the Instrumentation Key or Connection String
- Resource can be standalone or linked to a Log Analytics workspace
2. Add instrumentation to your application:
- Install the Application Insights SDK for your platform (.NET, Java, Node.js, Python)
- Configure the instrumentation key in your application
- Optionally enable advanced features (profiling, snapshot debugging)
3. Deploy instrumented application:
- The instrumentation monitors your app and sends telemetry data to the portal
- The application can run anywhere—it doesn't have to be hosted in Azure
- Works with on-premises applications, other cloud providers, edge devices
What gets instrumented?
You can instrument multiple application components for complete visibility:
Web service application:
- ASP.NET, ASP.NET Core, Java Spring Boot, Node.js Express applications
- Automatically captures requests, response times, exceptions
- Tracks dependencies (database calls, external APIs, message queues)
Background components:
- Azure Functions, WebJobs, Worker Services
- Console applications and batch processes
- Scheduled tasks and background jobs
JavaScript in web pages:
- Client-side SDK runs in user browsers
- Tracks page views, AJAX calls, browser exceptions
- Measures client-side performance (page load time, rendering)
- Monitors single-page applications (React, Angular, Vue)
Comprehensive telemetry collection
Application Insights provides multiple telemetry sources for complete observability:
Host environment integration:
- Pull in telemetry from host environments such as performance counters, Azure diagnostics, or Docker logs
- Correlate infrastructure metrics with application performance
- Understand if issues are application-level or infrastructure-level
Synthetic monitoring:
- Set up web tests periodically, sending synthetic requests to your web service
- Monitor availability from multiple global locations
- Validate multi-step user scenarios
- Alert when endpoints become unavailable
Unified analysis:
- All these telemetry streams are integrated into the Azure portal
- Apply powerful analytic and search tools to the raw data
- Use KQL to query across all telemetry types
- Correlate events from different sources using operation IDs
What's the overhead?
The impact on your app's performance is minimal. Application Insights is designed for production use with negligible performance cost:
Performance characteristics:
- Tracking calls are non-blocking: Telemetry collection doesn't slow down request processing
- Batched transmission: Events are batched and sent in a separate thread
- Asynchronous operations: No waiting for telemetry to be transmitted
- Adaptive sampling: Automatically reduces data volume while maintaining statistical accuracy
- Typical overhead: <1% CPU impact, ~50-100 KB/s network per instance
Sampling strategies:
- Fixed-rate sampling: Collect a percentage of all telemetry (e.g., 20%)
- Adaptive sampling: Automatically adjusts based on traffic volume
- Ingestion sampling: Applied at Azure portal to reduce stored data
- Sampling preserves context: Related telemetry is sampled together
What does Application Insights monitor?
Application Insights is aimed at the development team to help you understand how your app is performing and being used. It provides comprehensive monitoring across multiple dimensions:
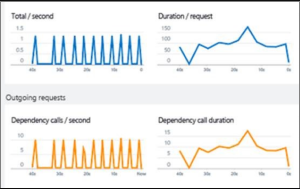
Application performance metrics
Request rates, response times, and failure rates:
- Find out which pages are most popular, at what times of day, and where your users are located
- See which pages perform best and which need optimization
- Key insight: If response times and failure rates increase with more requests, you likely have a resourcing or capacity problem
Dependency rates, response times, and failure rates:
- Track calls to databases, external APIs, message queues, and storage
- Find out whether external services are slowing you down
- Identify the slowest dependencies impacting user experience
- Detect cascading failures from downstream services
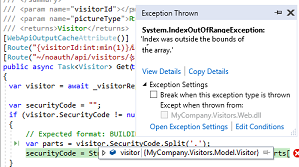
Error and exception tracking
Exceptions:
- Analyze aggregated statistics showing exception trends over time
- Pick specific instances and drill into the full stack trace
- See related requests to understand context when exception occurred
- Both server and browser exceptions are reported for complete visibility
- Track unhandled vs. handled exceptions
Client-side monitoring
Pageviews and load performance:
- Reported by your users' browsers showing real-world experience
- Measure Time to Interactive (TTI), First Contentful Paint (FCP)
- Identify slow-loading pages affecting user experience
AJAX calls from web pages:
- Track rates, response times, and failure rates for API calls
- Identify which API endpoints are slow from client perspective
- Monitor single-page application (SPA) navigation
User analytics
User and session count:
- Track daily/monthly active users (DAU/MAU)
- Understand session duration and frequency
- Measure user retention and churn
Infrastructure integration
Performance counters:
- Collect from Windows or Linux server machines
- Include CPU, memory, and network usage
- Correlate infrastructure metrics with application performance
Host diagnostics:
- Monitor Docker containers and Azure resources
- Track resource utilization per container
- Understand infrastructure health alongside application health
Diagnostic capabilities
Diagnostic trace logs:
- Capture logs from your application framework (ILogger, Log4j, etc.)
- Correlate trace events with requests using operation IDs
- Search logs for specific errors or patterns
- Filter by severity level, time range, or custom properties
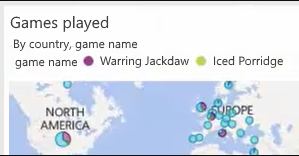
Custom business telemetry
Custom events and metrics:
- Write custom telemetry in client or server code
- Track business events such as items sold, games won, subscriptions created
- Measure business-specific metrics like cart value, conversion funnel steps
- Create custom dimensions for segmentation (customer tier, feature flags)
Where do I see my telemetry?
Application Insights provides multiple interfaces for exploring your data, each optimized for different scenarios. There are plenty of ways to explore your data.
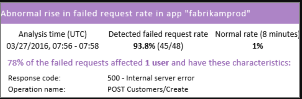
Smart detection and alerts
Smart detection and manual alerts provide proactive notification of issues:
Automatic alerts adapt to your app's usual patterns of telemetry and trigger when there's something outside the usual pattern. Machine learning algorithms identify:
- Abnormal rise in failure rates: Sudden spike in exceptions or failed requests
- Performance degradations: Response times slower than typical patterns
- Memory leaks: Gradual memory increase over time
- Dependency anomalies: External service calls exhibiting unusual behavior
You can also set manual alerts on levels of custom or standard metrics with configurable thresholds, severity levels, and action groups.
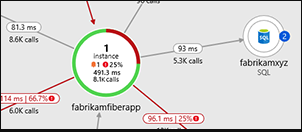
Application Map
Visualize the components of your app with key metrics and alerts. The application map automatically discovers:
- Application topology: All components and their connections
- Dependency relationships: Which services call which dependencies
- Health indicators: Color-coded health status per component
- Key metrics: Request rate, failure rate, response time per component
- Active alerts: Visual indicators showing which components have issues
Use cases: Quickly identify which component in a distributed system is failing, understand call patterns, plan capacity per service.
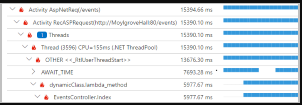
Application Insights Profiler
Inspect the execution profiles of sampled requests to identify performance bottlenecks:
- Code-level performance: See exactly which methods consume the most time
- Call tree visualization: Understand the execution path through your code
- Sampled profiling: Low overhead collection from production environments
- Flame graphs: Visual representation of time spent in each function
Use cases: Identify slow database queries, inefficient algorithms, excessive string allocations, lock contention.
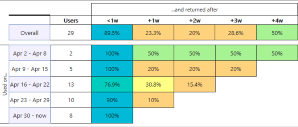
Usage Analysis
Analyze user segmentation and retention to understand how users interact with your application:
- User flows: Visualize navigation paths through your application
- Funnels: Track conversion rates through multi-step processes
- Cohorts: Group users by behavior or attributes for comparison
- Retention: Measure how many users return over time
- Impact analysis: Correlate performance with user behavior
Use cases: Optimize conversion funnels, understand feature adoption, identify at-risk users, measure product-market fit.
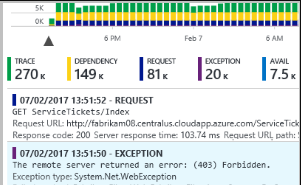
Diagnostic Search
Search and filter events for detailed investigation:
- Event types: Requests, exceptions, dependency calls, log traces, page views, custom events
- Filtering: By time range, result code, operation name, custom properties
- Full-text search: Find events containing specific text
- Related telemetry: Click an event to see all related telemetry (end-to-end transaction)
Use cases: Investigate specific user-reported issues, find errors for specific customers, trace requests across distributed systems.
Metrics Explorer
Explore, filter, and segment aggregated data:
- Metrics: Rates of requests, failures, exceptions, response times, page load times, custom metrics
- Splitting: Segment by dimensions (cloud role, geography, browser, device)
- Filtering: Focus on specific values
- Aggregation: Min, max, avg, sum, percentiles
- Time granularity: 1 minute to 1 month buckets
Use cases: Capacity planning, SLA tracking, comparing performance across regions, identifying trends.
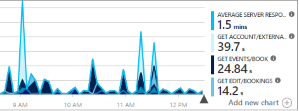
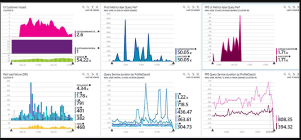
Dashboards
Mash up data from multiple resources and share with others:
- Multi-resource: Combine data from multiple Application Insights instances
- Customizable tiles: Pin queries, metrics, and visualizations
- Shared dashboards: Publish to teams for collaborative monitoring
- Continuous display: Great for multi-component applications and team rooms
Use cases: Executive dashboards, war rooms during incidents, team situational awareness, status displays.
Live Metrics Stream
Watch near-real-time performance indicators:
- 1-second refresh: See metrics updating in real-time
- Deployment validation: When you deploy a new build, ensure everything works as expected
- Live events: Stream of requests, dependencies, exceptions as they occur
- Server health: Live view of server count, CPU, memory
- Filtering: Focus on specific servers or failure types
Use cases: Deployment validation, live troubleshooting, load testing observation, incident response.
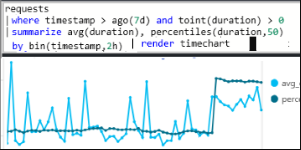
Analytics (KQL Queries)
Answer challenging questions about your app's performance and usage by using this powerful query language:
- KQL (Kusto Query Language): Same language covered in previous unit
- Ad-hoc analysis: Explore data without predefined views
- Complex joins: Correlate data across multiple tables
- Advanced visualizations: Create custom charts and time-series
- Saved queries: Reuse common analysis patterns
Use cases: Root cause analysis, capacity planning, custom reports, data exploration.
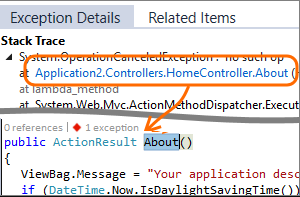
Visual Studio Integration
See performance data in the code:
- CodeLens: Performance metrics displayed inline in your code editor
- Go to code from stack traces: Click exception in portal, jump to code line
- Local debugging: Application Insights integration in Visual Studio debugger
- Trends: Historical performance trends for specific methods
Use cases: Performance optimization during development, debugging production issues locally.
Snapshot Debugger
Debug snapshots sampled from live operations:
- Production debugging: Capture full memory snapshots from production
- Parameter values: See local variables and parameters at exception time
- Call stack: Complete stack trace with variable values at each frame
- No performance impact: Snapshots collected with minimal overhead
- Privacy controls: Configure which data to capture
Use cases: Debug hard-to-reproduce production issues, understand exceptions in customer environments.
Power BI Integration
Integrate usage metrics with other business intelligence:
- Custom reports: Create Power BI dashboards combining Application Insights and business data
- Scheduled refresh: Automatic data updates
- Correlation: Link technical metrics to business outcomes
- Executive reporting: Present technical data in business context
Use cases: Board-level reporting, correlating application performance with revenue, SLA compliance reporting.
REST API
Write code to run queries over your metrics and raw data:
- Programmatic access: Query Application Insights from your own applications
- Automation: Build custom monitoring solutions
- Integration: Connect to third-party tools and workflows
- Custom processing: Export data for advanced analysis
Use cases: Custom dashboards, SLA monitoring systems, automated reporting, data science pipelines.
Continuous Export
Bulk export of raw data to storage as soon as it arrives:
- Azure Storage: Export to Blob Storage for long-term retention
- Event Hubs: Stream to real-time processing systems
- Data Lake: Integrate with big data analytics platforms
- Compliance: Meet data residency and retention requirements
- Cost optimization: Store data in cheaper storage tiers
Use cases: Long-term archiving, feeding data warehouses, compliance requirements, custom analysis at scale.