Exercise - Add Application Insights to an ASP.NET core application
Application performance management (APM) is a discipline that includes all the tools and activities involved in observing how software and hardware are doing.
These tools present performance information in the form product owners, and software development teams can use to make decisions.
Application Insights is a Microsoft Azure native APM Tool that is cross-platform. It's specialized in providing a rich & intelligent performance management toolset for Azure-hosted web apps.
In this tutorial, we'll learn how to start with App Insights. We'll cover,
- Adding App Insights to your dotnet core app
- Accessing App Insights from within the Azure portal
Getting started
To add Application Insights to your ASP.NET website, you need to:
- Install Visual Studio 2019 for Windows with the following workloads:
- ASP.NET and web development (Don't uncheck the optional components)
In Visual Studio, create a new dotnet core project. Right-click the project and select
Add, Application Insights Telemetry from the context menu.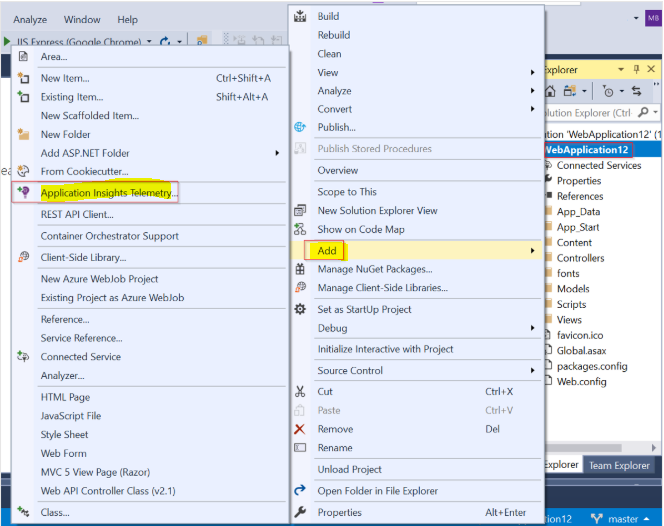
(Depending on your Application Insights SDK version, you may be prompted to upgrade to the latest SDK release. If prompted, select Update SDK.)
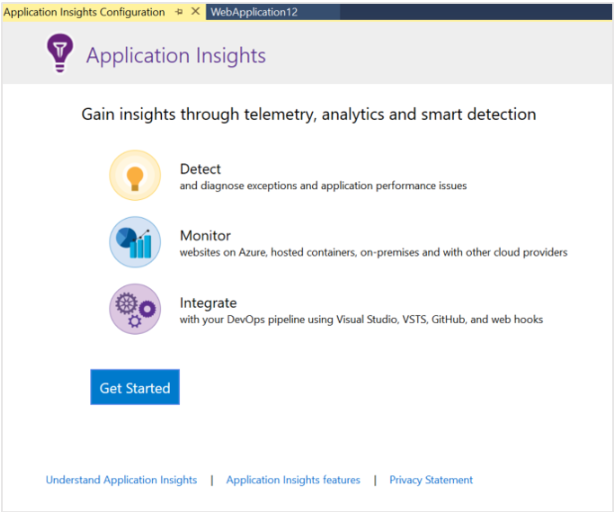
From the Application Insights configuration screen, click Get Started to start setting up App Insights.
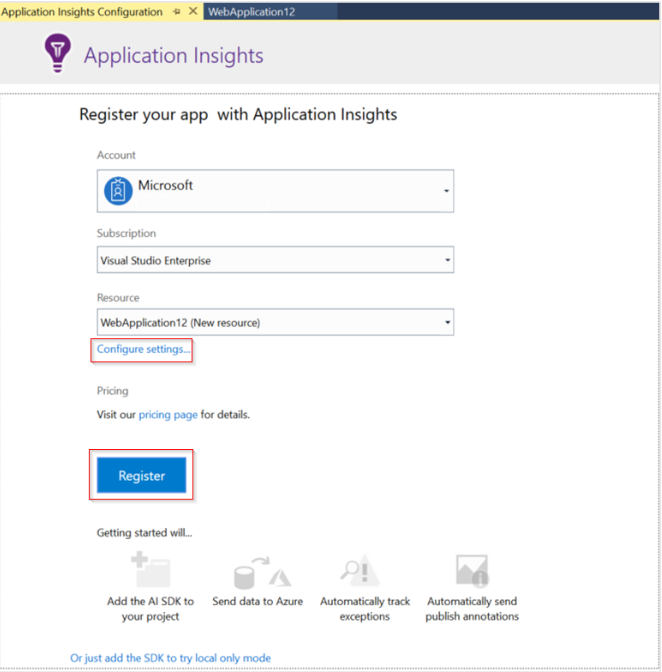
Choose to set up a new resource group and select the location where you want the telemetry data to be persisted.
Summary
So far, we have added App Insights in a dotnet core application.
The Application Insights getting started experience allows you to create a new resource group in the wished location where the App Insights instance gets created.
The instrumentation key for the app insights instance is injected into the application configuration automatically.
How to do it
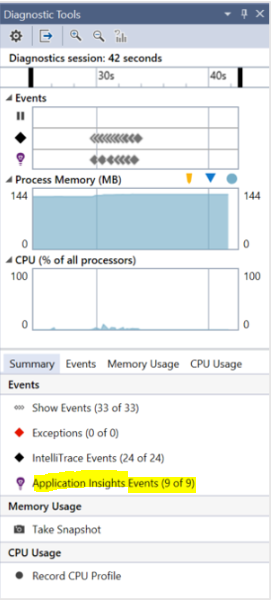
Run your app with F5. Open different pages to generate some telemetry. In Visual Studio, you'll see a count of the events that have been logged.
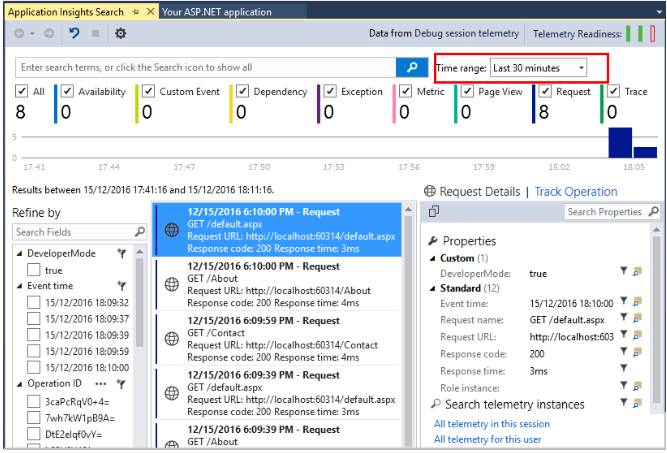
You can see your telemetry in Visual Studio or the Application Insights web portal. Search telemetry in Visual Studio to help you debug your app. Monitor performance and usage in the web portal when your system is live. In Visual Studio, view Application Insights data. Select Solution Explorer > Connected Services > Right-click Application Insights, then click Search-Live Telemetry.
In the Visual Studio Application Insights Search window, you'll see the data from your application for telemetry generated on the server side of your app. Experiment with the filters, and click any event to see more detail.
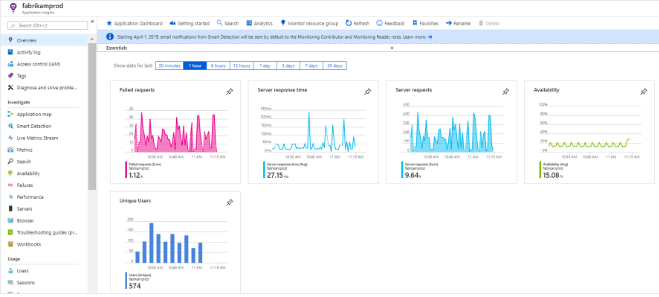
You can also see telemetry in the Application Insights web portal (unless you choose to install only the SDK). The portal has more charts, analytic tools, and cross-component views than Visual Studio. The portal also provides alerts.
Open your Application Insights resource. Either sign into the Azure portal and find it there, or select Solution Explorer > Connected Services > right-click Application Insights > Open Application Insights Portal and let it take you there.
The portal opens on a view of the telemetry from your app.
How it works
Application Insights configures your application's unique key (AppInsights Key). The Application Insights SDK uses this key to identify the Azure App Insights workspace the telemetry data needs to be uploaded. The SDK and the key are merely used to pump the telemetry data points out of your application. The heavy lifting of data correlation, analysis, and insights is done within Azure.
There's more
This tutorial taught us how to add Application Insights to your dotnet core application.
App Insights offers a wide range of features.
You can learn more about these at Start Monitoring Your ASP.NET Core Web Application.