Exercise - Run code in the debug environment
The Visual Studio Code user interface enables developers to run their code in a debug environment. Support for debugging is provided by extensions, and for C# developers, debugger support is provided by the same extension that provides support for code development and IntelliSense.
Debugger and application interaction
A code debugger can be used to pause and resume code execution, examine variable state, and even change the values assigned to variables at runtime. You may be wondering, how can the debugger control and modify a running application? The short answer is, the debugger has access to the application's runtime environment and executable code.
Note
Debugger interaction with the runtime environment is an advanced topic. In addition, understanding how the debugger works behind the scenes isn't a requirement for using the debugger. However, the following description may satisfy your curiosity.
The Visual Studio Code debugger for C# uses the .NET runtime to launch and interact with an application. When you start the debugger, it creates a new instance of the runtime and runs the application within that instance. The runtime includes an application programming interface (API), which the debugger uses to attach to the running process (your application).
Once your application is running and the debugger is attached, the debugger communicates with the running process using the .NET runtime's debugging APIs and a standard debug protocol. The debugger can interact with the process (the application running within the .NET runtime instance) by setting breakpoints, stepping through code, and inspecting variables. Visual Studio Code's debugger interface enables you to navigate the source code, view call stacks, and evaluate expressions.
The most common way to specify a debug session is a launch configuration in the launch.json file. This approach is the default option enabled by the debugger tools. For example, if you create a C# console application and select Start Debugging from the Run menu, the debugger uses this approach to launch, attach to, and then interact with your application.
Create a new code project
The first step in learning the debugger tools is creating a code project that you can run in the debugger.
Open a new instance of Visual Studio Code.
On the File menu, select Open Folder.
On the Open Folder dialog, navigate to your Windows Desktop folder.
On the Open Folder dialog, select New folder.
Name the new folder Debug101, and then select Select Folder.
On the Terminal menu, select New Terminal.
A .NET CLI command can be used to create a new console app.
At the TERMINAL panel command prompt, enter the following command:
dotnet new consoleClose the TERMINAL panel.
Examine launch configurations for debugging
Visual Studio Code uses a launch configuration file to specify the application that runs in the debug environment.
If the Debug101 folder doesn't include a Debug101.sln file, select Program.cs, and then verify that a .sln file is created.
Opening a C# code file prompts the environment to check for project files. The .sln file is a solution file that is used by Visual Studio to manage projects and is usually created automatically when you create a new project in Visual Studio Code. The .sln file is used by the debugger to identify the project that should be run in the debug environment.
On the View menu, select Command Palette.
At the command prompt, enter .net: g and then select .NET: Generate Assets for Build and Debug.
Notice the new
.vscodefolder that has been added to your project folder.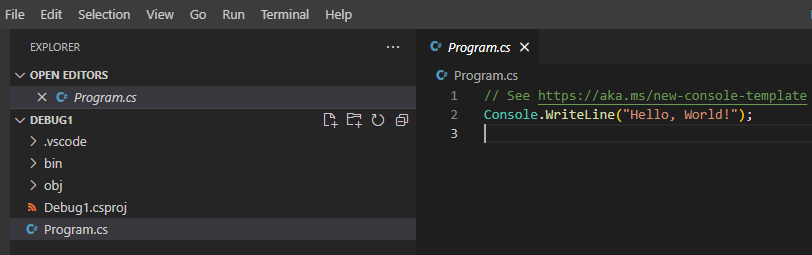
The
.vscodefolder contains files that are used to configure the debug environment.Expand the
.vscodefolder, and then select the launch.json file.Take a minute to examine the launch.json file.
The launch configurations file can include multiple configurations. Each configuration includes a collection of attributes that are used to define that configuration.
Notice that the prelaunchTask attribute specifies a build task.
In the
.vscodefolder, select tasks.json.Notice that the tasks.json file contains the build task for your code project.
Close the launch.json and tasks.json files.
You take a closer look at the launch configuration attributes later in this module.
Run your code from the Run menu
The Run menu in Visual Studio Code provides the option to run your code with or without the debugger.
Open the Program.cs file.
Replace the contents of your Program.cs file with the following code:
/*
This code uses a names array and corresponding methods to display
greeting messages
*/

string[] names = new string[] { "Sophia", "Andrew", "AllGreetings" };

string messageText = "";

foreach (string name in names)
{
    if (name == "Sophia")
        messageText = SophiaMessage();
    else if (name == "Andrew")
        messageText = AndrewMessage();
    else if (name == "AllGreetings")
        messageText = SophiaMessage();
        messageText = messageText + "\n\r" + AndrewMessage();

    Console.WriteLine(messageText + "\n\r");
}

bool pauseCode = true;
while (pauseCode == true);

static string SophiaMessage()
{
    return "Hello, my name is Sophia.";
}

static string AndrewMessage()
{
    return "Hi, my name is Andrew. Good to meet you.";
}
On the File menu, select Save.
Open the Run menu.
Notice that the Run menu provides options for running your code with or without debugging.
On the Run menu, select Run Without Debugging
Notice that the DEBUG CONSOLE panel displays console output, and that the Debug toolbar displays execution controls.
The DEBUG CONSOLE panel should be displayed below the code Editor. By default, the Debug toolbar (the small toolbar displaying code execution controls) is located above the code Editor and horizontally centered on the Visual Studio Code window.
On the Debug toolbar, select Stop.
Start a debug session from the Run menu
The Run menu includes the option to start a debug session.
On the Run menu, select Start Debugging
Take a minute to review the messages displayed in the DEBUG CONSOLE panel.
The output from your application is the same as when you ran without debugging, but other messages related to preparing the debug environment are displayed.
Notice the messages about loading .NET resources and your Debug101 application.
The first two messages report loading the .NET library and then your Debug101 application.
Loaded 'C:\Program Files\dotnet\shared\Microsoft.NETCore.App\10.0.0\System.Private.CoreLib.dll'. Skipped loading symbols. Module is optimized and the debugger option 'Just My Code' is enabled.
Loaded 'C:\Users\someuser\Desktop\Debug101\bin\Debug\net10.0\Debug101.dll'. Symbols loaded.
The debugger uses a special instance of the .NET runtime to control the execution of your application and evaluate application state.
On the Debug toolbar, select Stop.
Run your code from the Run and Debug view
The RUN AND DEBUG view in Visual Studio Code supports a rich debugging experience.
Switch to the RUN AND DEBUG view.
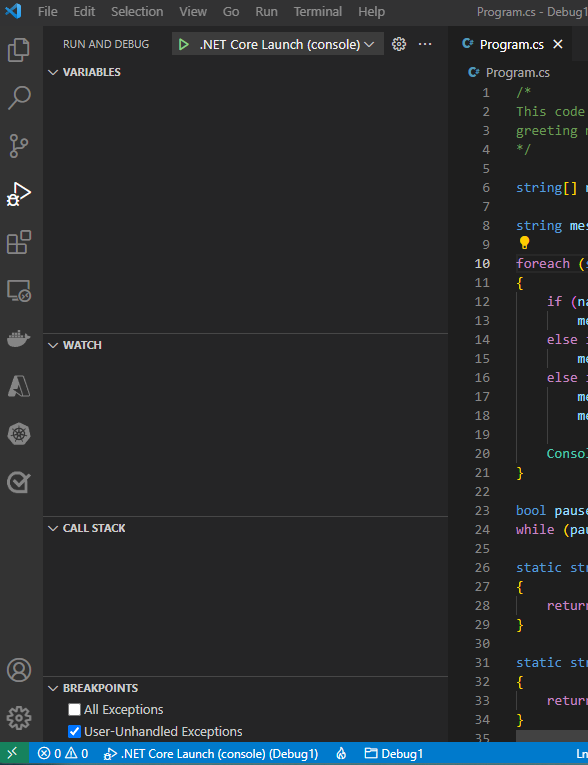
In the RUN AND DEBUG view, select Start Debugging.
The Start Debugging button is the green arrow on the control panel at the top of the view.
Notice that the DEBUG CONSOLE panel shows the same messages about configuring the debugger that were displayed when starting a debug process from the Run menu.
On the Debug toolbar, select Stop.
Examine the output from your application
Before closing the DEBUG CONSOLE panel, take a minute to review the output that your code produced.
Notice that Andrew's greeting message is repeated unexpectedly.
During the remainder of this module, you'll use the Visual Studio Code debugger tools to investigate coding issues.
Recap
Here are a few important things to remember from this unit:
- The Visual Studio Code debugger for C# uses the .NET runtime to launch and interact with an application.
- The Visual Studio Code Run menu has options to start an application with and without the debugger attached.
- The Debug toolbar includes a button to Stop a running process.
- The RUN AND DEBUG view includes an option to start debugging an application.