Capture network traffic with network watcher
While planning Contoso's migration to Microsoft Azure, you continue to evaluate network security features that manage network traffic. To gather data on the company's network traffic, you implement Azure Network Watcher.
What is Azure Network Watcher?
Azure Network Watcher can perform the following services:
- Monitoring
- Diagnosing
- Reviewing metrics
- Managing logs
Monitoring
Monitoring communication between a VM and an endpoint
You can use Azure Network Watcher to monitor communications between VMs and endpoints.
Note
Endpoints can be another VM, an FQDN, a URI, or an IPv4 address.
Azure Network Watcher uses its connection monitor feature to perform this monitoring. The connection monitor capability monitors communication at a regular interval and notifies you about the actions in the following table.
| Notification | Explanation |
|---|---|
| Reachability | If an endpoint is not reachable, connection troubleshoot informs you of the reason. Possible reasons include: a Domain Name System (DNS) name resolution problem; the CPU, memory, or firewall within the operating system (OS) of a VM; the hop type of a custom route; or a security rule for the VM or subnet of the outbound connection. |
| Latency | Connection monitor also provides the minimum, average, and maximum latency recorded over time. After connection monitor has learned the latency for a connection, you might find that you can decrease the latency by moving your Azure resources to different Azure regions. |
| Network topology changes | A network topology change might result when you have a web server VM that communicates with a database server VM, and another administrator in your organization applies a network security rule to the web server without your knowledge. |
To learn more about connection monitor, refer to Tutorial: Monitor network communication between two VMs using the Azure portal.
Network performance monitor is a cloud-based hybrid network monitoring solution that can help you monitor your network performance between various points in your network infrastructure. It can also help you monitor network connectivity to service and application endpoints and monitor the performance of Azure ExpressRoute.
Network performance monitor:
- Detects network issues that you can't detect with conventional network monitoring methods, such as routing errors.
- Generates alerts and notifies you when a network link threshold is exceeded.
- Ensures timely detection of network performance issues and localizes the source of the problem to a particular network segment or device.
Note
Learn more about network performance monitor at Network Performance Monitor solution in Azure.
Accessing resources in a VNet
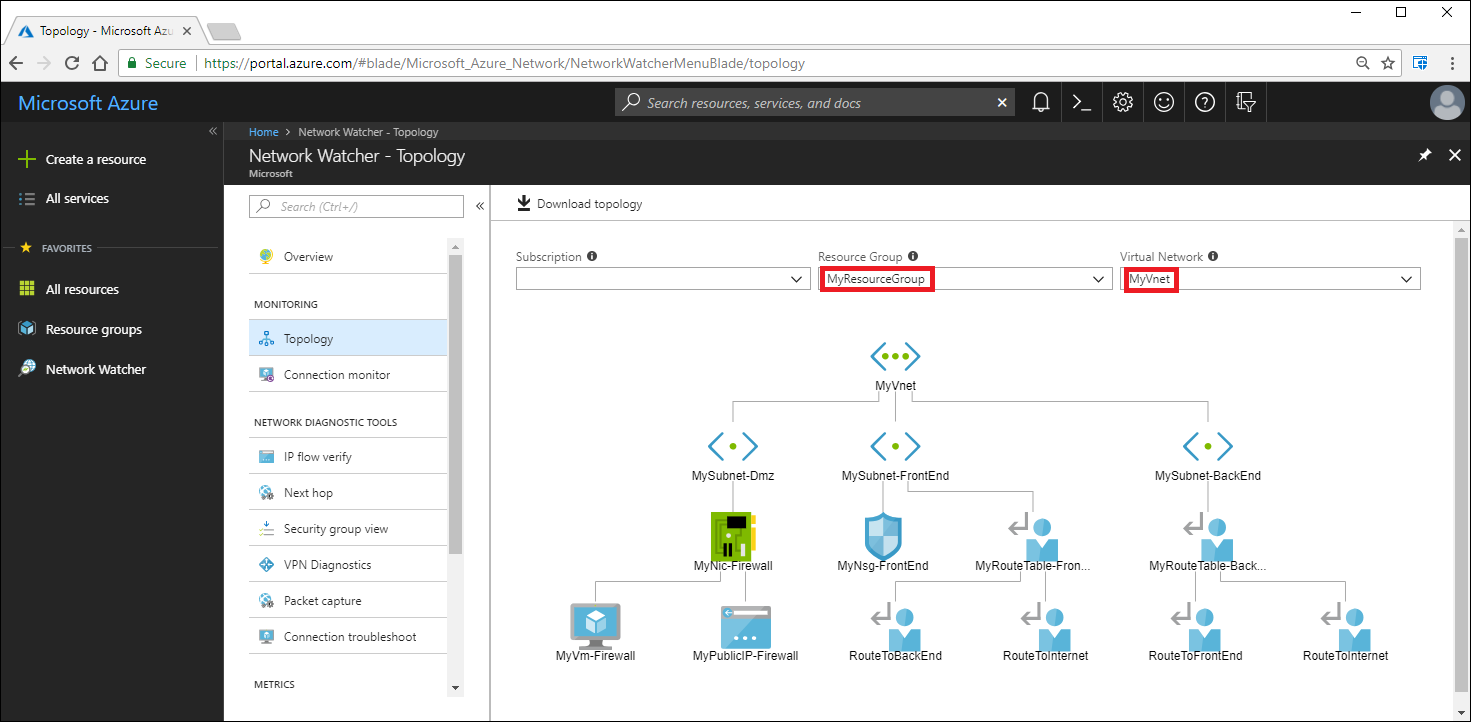
As you add resources to a VNet, you might begin to find it harder to understand what resources are in a VNet, and how those resources relate to each other. The topology capability allows you to generate a diagram of the resources in a VNet. The diagram also displays the relationships between those resources.
Note
Read more about topology reviewing at View the topology of an Azure VNet.
Diagnosing
Network Watcher provides a number of useful diagnostics capabilities, as described in the following table.
| Diagnostic requirement | Capability | Description |
|---|---|---|
| Diagnose network traffic filtering problems to or from a VM | IP flow verify capability | When you deploy a VM, Azure applies several default security rules to the VM. Later, you might create additional rules, or override Azure's default rules. As a consequence of an erroneous security rule change, a VM might not be able to communicate with other resources. You can use the IP flow verify capability to help resolve this issue. First, define a source and destination IPv4 address, port, protocol—Transmission Control Protocol (TCP) or User Datagram Protocol (UDP)—and traffic direction (inbound or outbound). IP flow verify then tests the configured communication and notifies you whether the connection is successful or not. In the event of communications failure, IP flow verify can notify you which security rule allowed (or denied) the selected communication, so that you can resolve the problem. |
| Diagnose network routing problems from a VM | Next hop capability | When you create a VNet, Azure creates several default outbound routes. The outbound traffic from all resources in a VNet is routed based on Azure's default routes. Later, you might create additional routes or override Azure's default routes. As a consequence of an erroneous route change, you might find that a VM can no longer communicate with other resources. The next hop capability enables you to specify a source and destination IPv4 address. Next hop then tests the communication and notifies you what type of next hop is used to route the traffic. You can then reconfigure routes to resolve the routing problem. |
| Diagnose outbound connections from a VM | Connection troubleshoot capability | The connection troubleshoot capability enables you to test a connection between a VM and other resources, such as another VM, an FQDN, a Uniform Resource Identifier (URI), or an IPv4 address. The test returns similar information to that provided by the connection monitor capability, but performs the test at a point in time rather than monitoring over time, as with connection monitor. |
| Capture packets to and from a VM | Packet capture capability | The packet capturing capability uses advanced filtering options and provides fine-tuned controls, which enable you to set time and size limitations, and hence provide versatility. You can store the capture in an Azure Storage account, on a VM's disk, or both. You can then analyze the capture file using several standard network capture analysis tools. |
| Diagnose problems with an Azure VNet gateway and connections | VPN troubleshoot capability | VNet gateways provide connectivity between on-premises resources and Azure VNets. Monitoring these gateways and their connections are critical to ensuring communication is not broken. The VPN diagnostics capability enables you to diagnose gateways and connections. VPN diagnostics diagnoses the health of the gateway, or gateway connection, and notifies you whether a gateway and gateway connections are available. If the gateway or connection isn't available, VPN diagnostics tells you why so that you can resolve the problem. |
| Determine relative latencies between Azure regions and internet service providers (ISPs) | Relative latency capability | You can query Network Watcher for latency information between Azure regions and across ISPs. When you know latencies between Azure regions and across ISPs, you can deploy Azure resources to optimize network response time. |
| Review security rules for a network interface | Effective security rules | The effective security rules for a network interface are a combination of all security rules applied to the network interface and the subnet the network interface is in. The security group review capability reports to you all security rules applied to the network interface, the subnet the network interface is in, and the aggregate of both. With an understanding of which rules are applied to a network interface, you can add, remove, or change rules if they're allowing or denying traffic that you want to change. |
Reviewing metrics
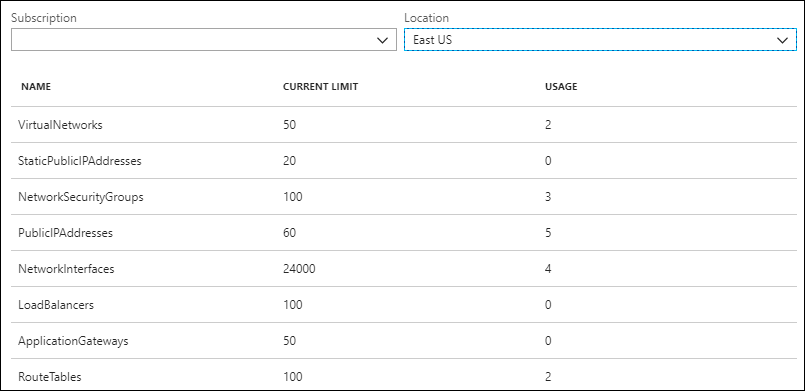
Within an Azure subscription and region, there are limits to the number of network resources that you can create, and you cannot create any more resources when you reach those limits. You can use the network subscription limit capability to provide a summary of how many of each network resource you have deployed in a particular subscription and region. You can also find out what the limit is for a particular resource. For example, in the following screenshot, the VirtualNetworks resource has a limit of 50, and the displayed usage is two.
Managing logs
Analyze network security group traffic
As you will remember, NSGs deny or allow network traffic to a network interface in a VM. The NSG flow log capability enables you to capture information about this traffic. You can then analyze the collected logs using a variety of tools, such as Power BI, and the traffic analytics capability. You can use the NSG flow log capability to capture the following:
- The source IP address
- The destination IP address
- The IP port
- The protocol
- Whether traffic was denied or allowed by the NSG
Review network resource diagnostic logs
The Diagnostic logs capability provides a single interface to enable and disable network resource diagnostic logs for any existing network resource that generates a diagnostic log. You can enable diagnostic logging for Azure networking resources, including:
- NSGs
- Public IP addresses
- Load balancers
- VNet gateways
- Application gateways
You can review diagnostic logs using tools such as Power BI and Azure Monitor logs.
Create an Azure Network Watcher instance
When you create or update a VNet in your Azure subscription, Network Watcher is automatically enabled in your VNet's region. If you enable Network Watcher using the Azure portal, the name of the Network Watcher instance is automatically set to NetworkWatcher_GUID, where GUID is a unique identity.
Note
The Network Watcher instance is automatically created in a resource group named NetworkWatcherRG. The resource group is created if it doesn't already exist.