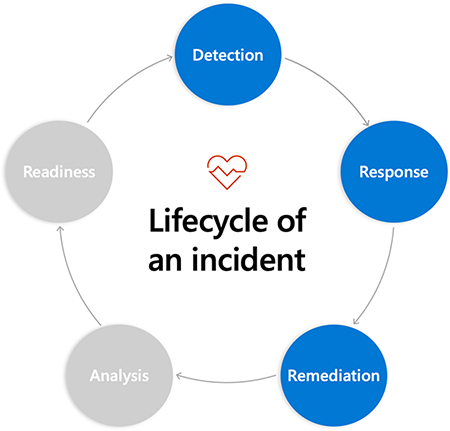
Remediation
Dividing the incident response lifecycle into five phases as you've seen in this module helps you to understand the process, but the phases aren't always as distinct as they appear in the diagram. In particular, the line between the response and remediation phases often begins to blur. This is especially true when actions intended to mitigate or improve the situation have the opposite effect. In this case, response and remediation tend to overlap or go back and forth between the two.
In this unit, you'll learn more about remediation and the steps that make up this phase, as well as some helpful tips and tools. One important thing to note: you shouldn't take the measures outlined here as a prescriptive checklist.
If you do indeed have a checklist for remediation already in hand, that's often an indicator that it is time to bring automation into the picture. When you can describe exactly what needs to be done and in what order to remediate a problem, it's the perfect time to teach these steps to a machine so the system can do it for you.
Where to start
You learned about the importance of reducing the time it takes to respond to an incident. Now let's look at a few things that can help speed up the process of remediating, or fixing the problem.
Different team members might have different mental models of how things work and different ideas as to what the first step should be. One might first look at the logs, while another might first run queries and look at the metrics. There is no one single correct path to success.
However, it helps to provide people with context and guidance as to where they should go and what they should look at.
How and to whom to escalate
An important question to answer in formulating your remediation starting point is: when you get stuck, who can you call to escalate the problem? You should be trying to offload more of the responsibilities of on-call to the team in general, not just Operations or Site Reliability Engineering. It should be the responsibility of all team members to have the systems up and running to meet your reliability objectives.
What resources are helpful to the first responders?
The next consideration is to determine those things that the first responders can use to get started on the process. This could include relevant metrics, logs, queries, and so forth. These should be provided in an Azure workbook/troubleshooting guide if possible. We'll talk about them in just a moment.
It's also useful to provide simple links to resources (often in a troubleshooting guide). If your goal is to respond and remediate the issue as quickly as possible, helping people find the answers to questions without having to search for the right document or URL will speed up the process.
Update stakeholders
You can become so focused on fixing the problem that you might forget that there are many people who aren't directly involved in the response to the incident, but who want and need to know what's going on.
It's important to communicate with other internal teams and keep them apprised of what's happening when an incident occurs. If you don't provide them with consistent updates, they're likely to come around asking for a status update. They have every right to this information, but you need a better way to make them aware of the issue and what's being done about it.
You need to be clear about acknowledgment to your internal teams. Be clear in presenting what you know and what's being done and set expectations in terms of when they'll hear back from you.
The formula for your communications to stakeholders is simple:
- This is what we know.
- This is what we're doing.
- We'll get back to you in X amount of time.
This will help prevent stakeholders from coming to you and interrupting you when you're in the midst of trying to fix the problems.
One way to distribute this information is through the use of an easily editable status web page like the one we mentioned in the last unit. In many cases, you might wish to have a separate, more detailed status page for internal stakeholders and an external one for your customers. The preceding formula works for both cases.
Use Azure Monitor Workbooks and Troubleshooting Guides
Azure has two closely related features that can be tremendously helpful to a team in the remediation phase: Azure Monitor Workbooks and Application Insights Troubleshooting Guides. For the purpose of this module, they're interchangeable, including having the same user interface. You can find Azure Monitor Workbooks in the Azure portal under Azure Monitor. You'll find Azure Insights Troubleshooting Guides in the Azure portal when an Applications Insight instance has been selected.
You can think of workbooks and troubleshooting guides as "live documents" you can create using a page-creation interface. When you create a new one, you can add to the page:
- Arbitrary text, like a bulleted list of items to do or other helpful information for someone consulting the page
- Links to other systems, for example, links to other dashboards or documentation
- Kusto Query Language (KQL) queries
It's that last item which makes the document "live." In a previous module in this learning path, we explored the KQL query language built into Log Analytics and other parts of Azure Monitor. Using this language, we could write our own queries to return and display diagnostic information from our application and Azure infrastructure. When a KQL query is inserted into a workbook or troubleshooting guide, the current results of that query are displayed live to the document's readers. This means that your troubleshooting guide can say not only "Be sure to check the error rate on the web server" but can also show a current graph for that error rate right there next to the instructions. It can have a link like "here is the web server restart documentation" that takes the first responder right to the documentation they need.
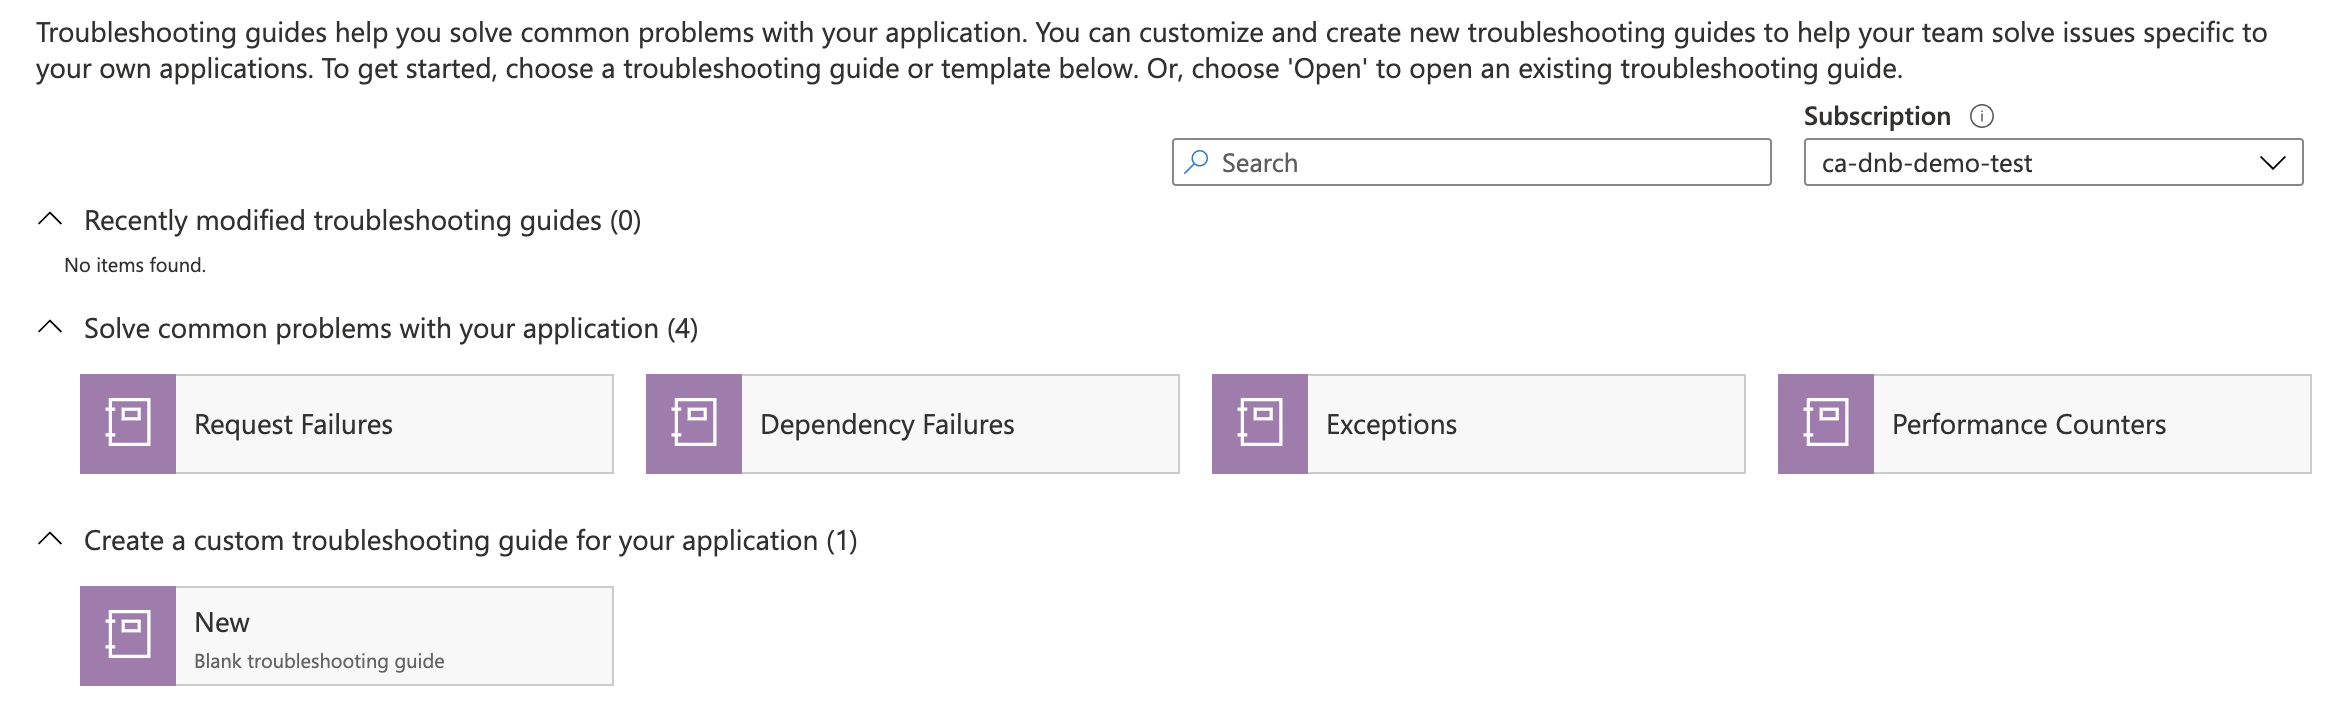
Azure also provides some existing templates to help you get started authoring your own documents. Here's a screenshot of some of the pre-made templates you may be offered:
There's an Advanced editor feature for Workbooks and troubleshooting guides that allow you to access and insert either a JSON or an Azure Resource Manager template representation of that document. This means that it's possible to track and distribute these documents using the source-control system of your choice. It also allows you to automate the provisioning of workbooks or troubleshooting guides, which is useful for when you're provisioning other infrastructure. Creating a set of custom troubleshooting documents to go with a new service at the time that the service is provisioned becomes easy using this best practice.
Other helpful tips and tools
Throughout this module, you've learned about the various tools and shortcuts you can use to increase the efficiency and reduce your incident response time. As we wrap up this last unit, we'll do a brief overview of some tools and techniques that are helpful in diagnosing problems within your systems.
- You can use the Application Dashboard link in Application Insights to automatically generate a dashboard that has most of the key items that you'll need as a starting point. Note that it doesn't include Azure Service Health. You should pin this to your dashboard so you can check on whether the problem is with your systems or with the cloud service itself.
- You can use the Application Map in Application Insights to drill into exactly what's going on to cause the issues. You can follow the breadcrumbs to find the cause of the error (for example, a malformed URL).
- You can use Log Analytics to query any part of the system.
All of the preceding tools are invaluable in remediating problems.