Exercise - Use metric alerts to alert on performance issues in your Azure environment
This module requires a sandbox to complete. A sandbox gives you access to free resources. Your personal subscription will not be charged. The sandbox may only be used to complete training on Microsoft Learn. Use for any other reason is prohibited, and may result in permanent loss of access to the sandbox.
Microsoft provides this lab experience and related content for educational purposes. All presented information is owned by Microsoft and intended solely for learning about the covered products and services in this Microsoft Learn module.
The shipping company you work for wants to avoid any future issues with updates to its applications on the Azure platform. To improve the alert capabilities in Azure, you made the choice to use Azure metric alerts.
In this exercise, you create a Linux virtual machine (VM). This VM runs an app that runs the CPU at 100 percent utilization. You create monitoring rules in the Azure portal and in the Azure CLI to alert you about high CPU usage.
Create the VM
This VM runs a specific configuration that stresses the CPU and generates the metric monitoring data needed to trigger an alert.
Start by creating the configuration script. To create the
cloud-init.txtfile with the configuration for the VM, run the following command in Azure Cloud Shell:Bashcat <<EOF > cloud-init.txt #cloud-config package_upgrade: true packages: - stress runcmd: - sudo stress --cpu 1 EOFTo set up an Ubuntu Linux VM, run the following
az vm createcommand. This command uses thecloud-init.txtfile that you created in the previous step to configure the newly created Ubuntu Linux VM.Azure CLIaz vm create \ --resource-group "[sandbox resource group name]" \ --name vm1 \ --location eastUS \ --image Ubuntu2204 \ --custom-data cloud-init.txt \ --generate-ssh-keys
Create the metric alert using the Azure portal
Note
Wait until the VM is successfully created before proceeding with the exercise. The VM creation process is complete when you get the completed JSON output in the Azure Cloud Shell window.
You can use either the Azure portal or the CLI to create a metric alert. In this exercise, we cover both, starting with the Azure portal.
Sign in to the Azure portal using the same account that you used to activate the sandbox.
On the Azure portal menu, search for and select Monitor. On the Monitor Overview page, select Alerts.
Open the + Create menu, and select Alert rule
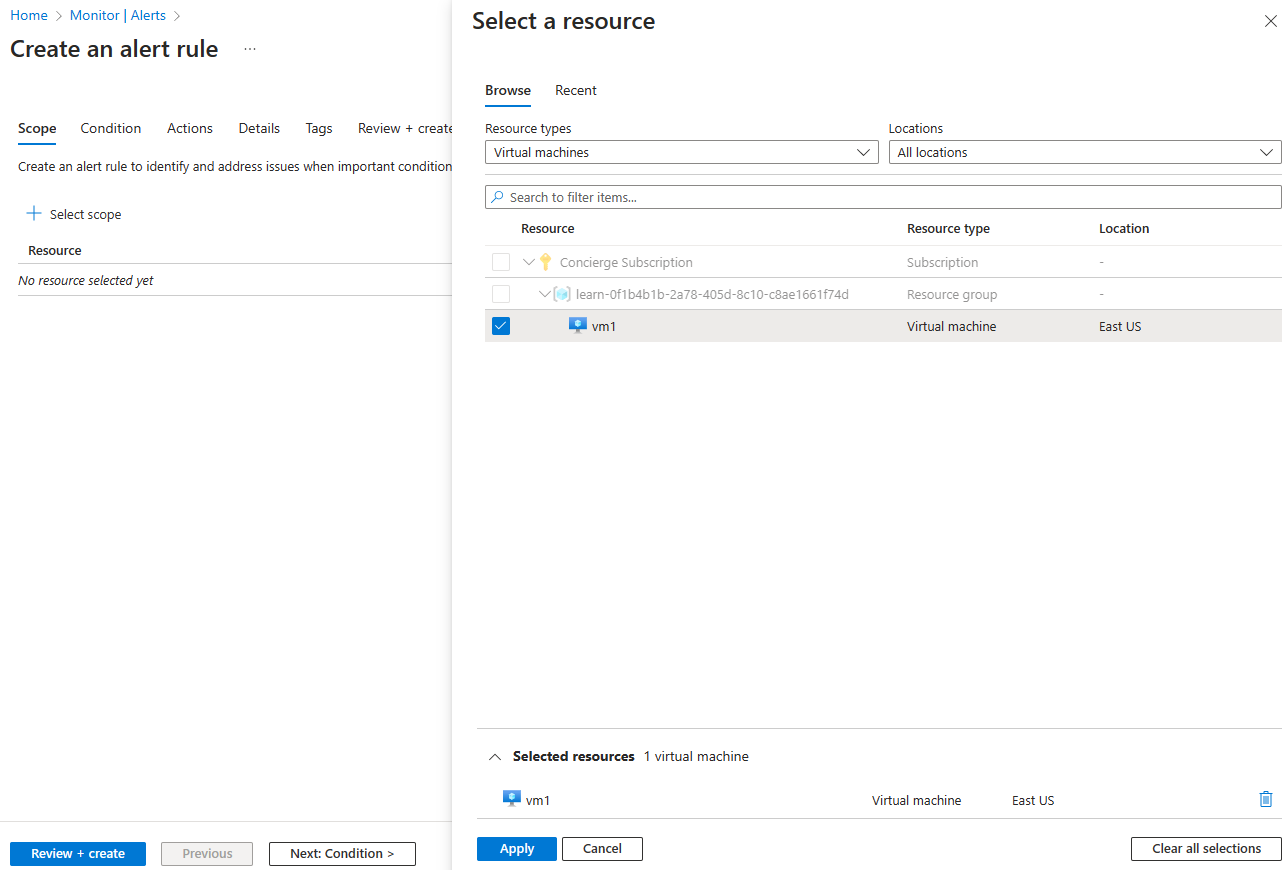
On the Select a resource pane, set the scope for your alert rule. You can filter by subscription, resource type, or resource location.
In the Resource types drop-down, start to type "virtual machines", and select Virtual machines.
Check the box next to vm1, then select Apply at the bottom of the pane.
Select Next:Condition at the bottom of the page.
In the Signal name drop-down, select Percentage CPU.
In the Alert logic section, enter (or confirm) the following values for each setting.
Setting Value Alert logic Threshold Static Aggregation type Maximum Operator Greater than Threshold value 90 When to evaluate Check every 1 minute Lookback period 1 minute 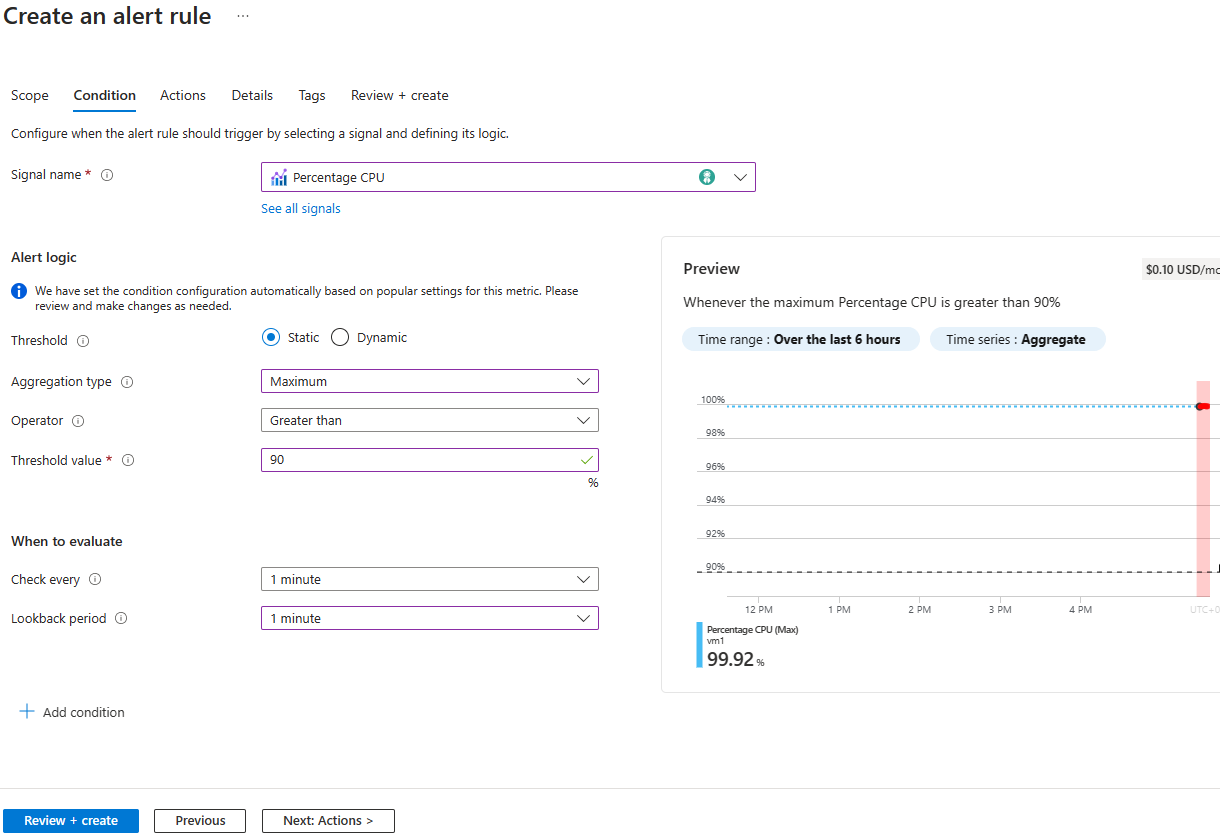
Select the Details tab at the top of the page. In the Alert rule details section, enter the following values for each setting.
Setting Value Severity 2 - Warning Alert rule name Cpu90PercentAlert Description Virtual machine is running at or greater than 90% CPU utilization Expand the Advanced options section and confirm the following values for each setting.
Setting Value Enable upon creation Yes (checked) Automatically resolve alerts Yes (checked) 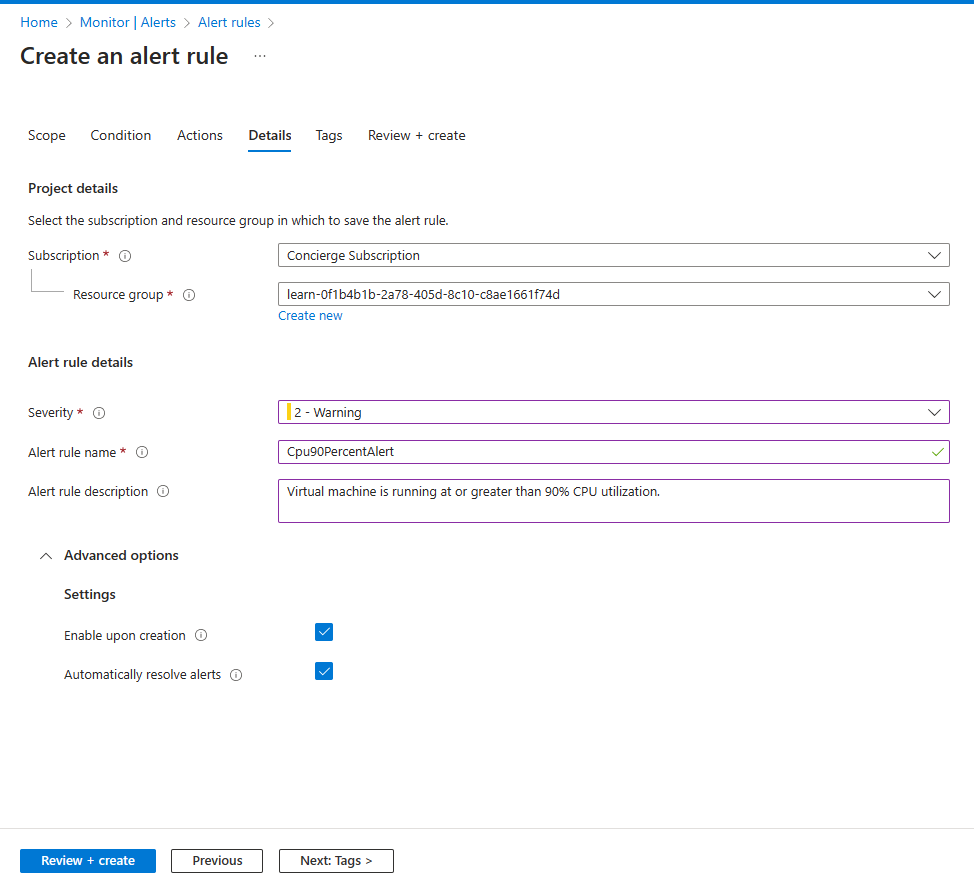
Select Review + create to validate your input, and then select Create.

You successfully created a metric alert rule that triggers an alert when the CPU percentage on the VM exceeds 90 percent. The rule checks every minute and reviews one minute of data. It can take up to 10 minutes for a metric alert rule to become active.
Create the metric alert through the CLI
You can also set up metric alerts by using the CLI. This process can be quicker than using the portal, especially if you're planning to set up more than one alert.
Let's create a new metric alert similar to the one you set up in the Azure portal.
Run the following command in Cloud Shell to obtain the resource ID of the virtual machine you previously created:
BashVMID=$(az vm show \ --resource-group "[sandbox resource group name]" \ --name vm1 \ --query id \ --output tsv)Run the following command to create a new metric alert. The alert is triggered when the VM CPU is greater than 80 percent.
Azure CLIaz monitor metrics alert create \ -n "Cpu80PercentAlert" \ --resource-group "[sandbox resource group name]" \ --scopes $VMID \ --condition "max percentage CPU > 80" \ --description "Virtual machine is running at or greater than 80% CPU utilization" \ --evaluation-frequency 1m \ --window-size 1m \ --severity 3
View your metric alerts in Azure Monitor
In this exercise, you set up an Ubuntu VM and configured it to stress test the CPU. You also created a metric rule to detect when the maximum CPU percentage exceeds 80 percent and 90 percent.
Note
It might take 10 minutes before you see the alerts show up in the Azure portal.
Return to the Azure portal.
On the Azure portal menu, select Monitor, and then select Alerts in the left menu pane.
This step presents the Alert summary pane, where you can see the count of the number of alerts. If you don't see your alerts listed, wait a few minutes and select Refresh.
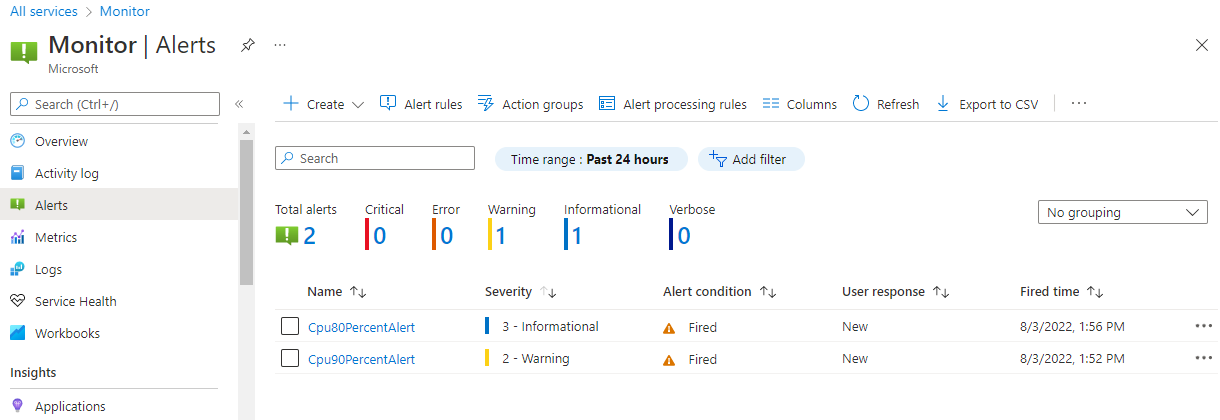
You configured your metric alerts with severities of 2 and 3. Select one of the alerts to view the severity level.
Select one of the alerts to show the alert details.
Next unit: Use log search alerts to alert on events in your application
Having an issue? We can help!
- For issues related to this module, explore existing questions using the #azure training tag or Ask a question on Microsoft Q&A.
- For issues related to Certifications and Exams, post on Certifications Support Forums or visit our Credentials Help.