Exercise - Explore the Visual Studio Code user interface
Visual Studio Code provides tools for developers who are just starting out, but is also extensible and advanced enough for professional developers.
In this exercise, you open Visual Studio Code and complete a quick tour of the user interface.
Open Visual Studio Code and examine the Welcome page
Use the Windows Start menu to open Visual Studio Code.
If you open the Windows Start menu, you should see Visual Studio Code listed as a recently added application. You can also scroll down to find Visual Studio Code.
Another option is to type Visual Studio Code in the Windows Search box on the launch tray at the bottom of the screen.
Notice that Visual Studio Code opens to a "Welcome" page that includes some links and other information.
The first time that you open Visual Studio Code, the Welcome page displays some helpful walkthroughs, like the Get Started with VS Code content. You can examine this information at your leisure another time.
To close the Welcome page, select the Close button (shown as an X in the interface).
Each page that's open in the Editor includes a Close button (X) located to the right of page title. The Welcome page tab is shown in the upper-left portion of the Visual Studio Code window, below the Main Menu. If you hover the mouse pointer over the X, the word Close appears.
Examine the Activity bar and Side bar
Notice that the Side bar to the right of the Activity bar is collapsed.
You may recall that the Activity bar is the vertical list of icons on the far left of the Visual Studio Code window. The contents of the Side bar are dependent on what is currently selected from the Activity bar.
Position your mouse pointer over the Activity bar, and then hover the mouse pointer over each of the icons to display labels.
A label appears when you hover over the icons. You should see the Activity bar buttons shown in the following image:
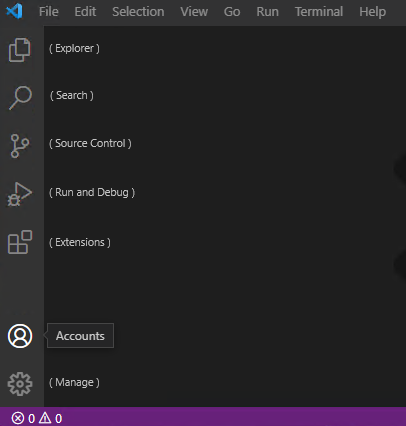
From top to bottom, the Activity bar icons are: Explorer, Search, Source Control, Run and Debug, Extensions, Accounts, and Manage.
On the Activity bar, select Explorer.
The Side bar should open and display contextual information.
Notice that the Side bar is now labeled EXPLORER.
The EXPLORER view is used to access/explore project folders and code files.
Visual Studio Code will remember your work history and open the most recent project files when it opens. Since this is the first time that you've opened Visual Studio Code, no project folder is opened.
On the Activity bar, select Extensions.
Notice that the Side bar is now labeled EXTENSIONS.
Take a moment to examine the information displayed in the EXTENSIONS view.
Visual Studio Code extensions enable you to add coding languages, debuggers, and other tools to the environment in support of your development workflow. You'll be installing a C# extension later in this module.
On the Activity bar, to close the EXTENSIONS Side bar, select Extensions.
Examine the top menu options
To view the File menu options, select File.
Notice the New, Open, Save, and Close options listed on the File menu.
Take a minute to examine the Edit menu options, and then each of the other top level menu items.
Notice that several of the menus include options for interacting with your code.
For example:
- The Edit menu includes options to find, replace, and toggle code comments, as well as the standard cut, copy, paste, undo, and redo.
- The Selection menu includes options for selecting and manipulating code lines.
- The Run menu includes options to run and debug your application.
On the Terminal menu, select New Terminal.
Take a moment to examine the contents of the Terminal panel.
You can switch between the tabs (PROBLEMS, OUTPUT, DEBUG CONSOLE, and TERMINAL) and hover the mouse pointer over the buttons (upper right) to display the button labels.
Notice that the Terminal panel includes a command prompt.
The Terminal panel can be used to run command line interface (CLI) commands. You'll be using .NET CLI commands later in this module.
In the upper-right corner of the Terminal panel, select X (Close Panel).
On the View menu, select Command Palette
The command palette can be used to find and run all sorts of useful commands. You don't have the time (or the need) to examine them in detail now, but it's good to know where to find the command palette.
At the command palette prompt, type extensions
Notice that the list of commands is filtered based on your entry.
To update the filtered list of commands, change extensions to help
From the list of command options, select Help: Interactive Editor Playground.
The Editor Playground document that opens in the Editor includes a list of interactive activities.
From the bulleted list of interactive activities, select Formatting.
Take a minute to read about the formatting options.
You'll be using code formatting commands during activities as you learn more about C# programming.
Close the Editor Playground document.
That completes your tour of the Visual Studio Code user interface. Once you begin coding, the training materials continue to point out ways that Visual Studio Code can help boost your productivity.