How Azure Service Health works
Each one of the three services that comprise Azure Service Health works in different ways.
Azure Status
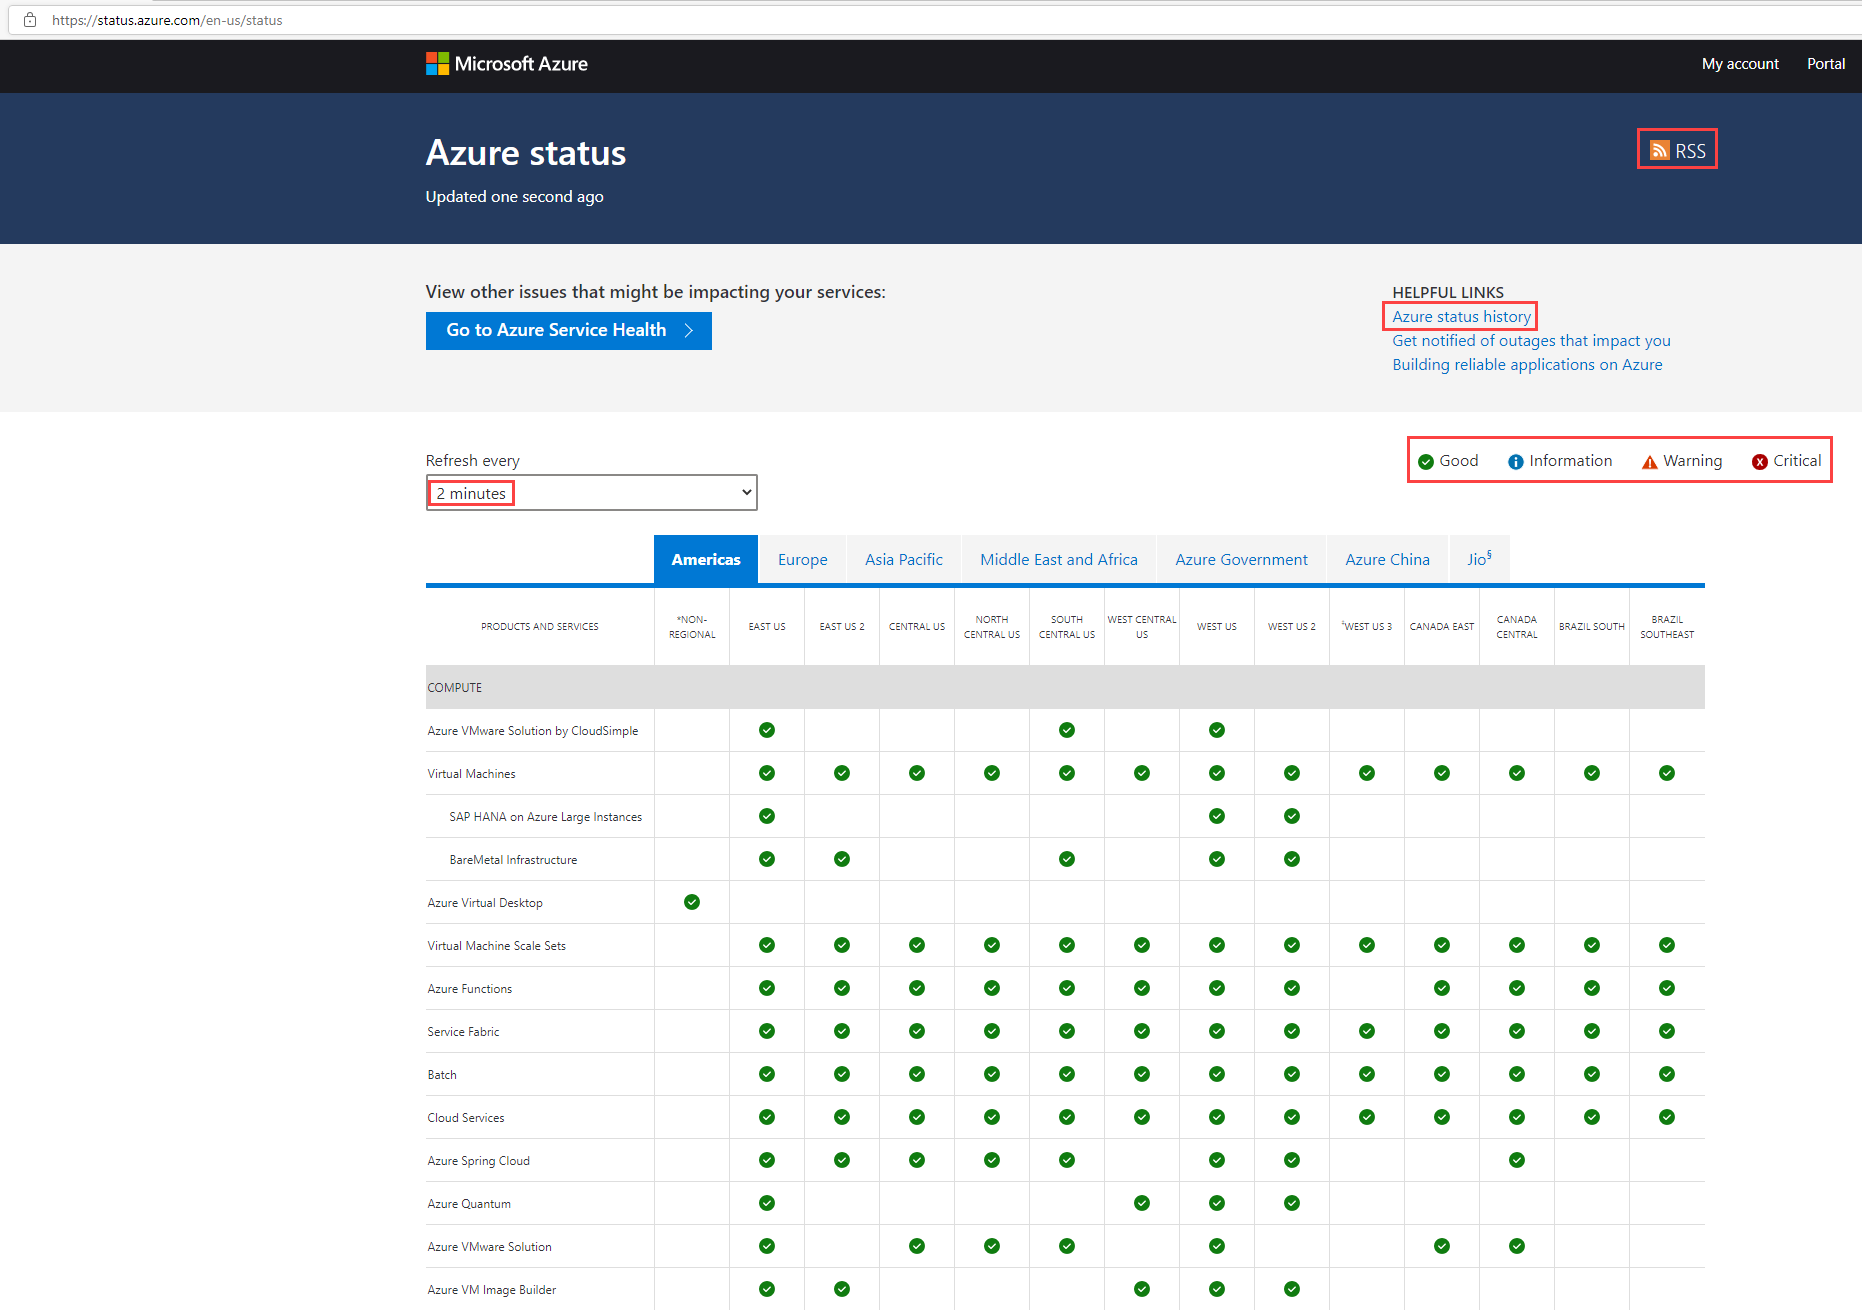
The Azure Status Page is where you can find public information about the health of Azure services across all regions.
On the page, you can set the automatic refresh period to:
- 2 minutes
- 5 minutes
- 10 minutes
- 30 minutes
You might find this useful if you want to have this information displayed in monitors at your NOC (Network Operation Center). The refresh rate allows you to customize the information displayed based on your service review needs.
The status page has all products and services listed by geographies and regions. There are four types of status indicators available. The indicators allow you to easily identify the service health by determining if the service is good, if there's some specific information available on that service, or if there's an indication of a warning or critical issue.
Tip
You'll also notice blank areas in the table. These blank areas indicate that a service is not available in the region listed.
You can also choose to get an RSS feed that provides updates on the service health. You can find the RSS tag on this page in the upper-right section of the title area.
Service Health
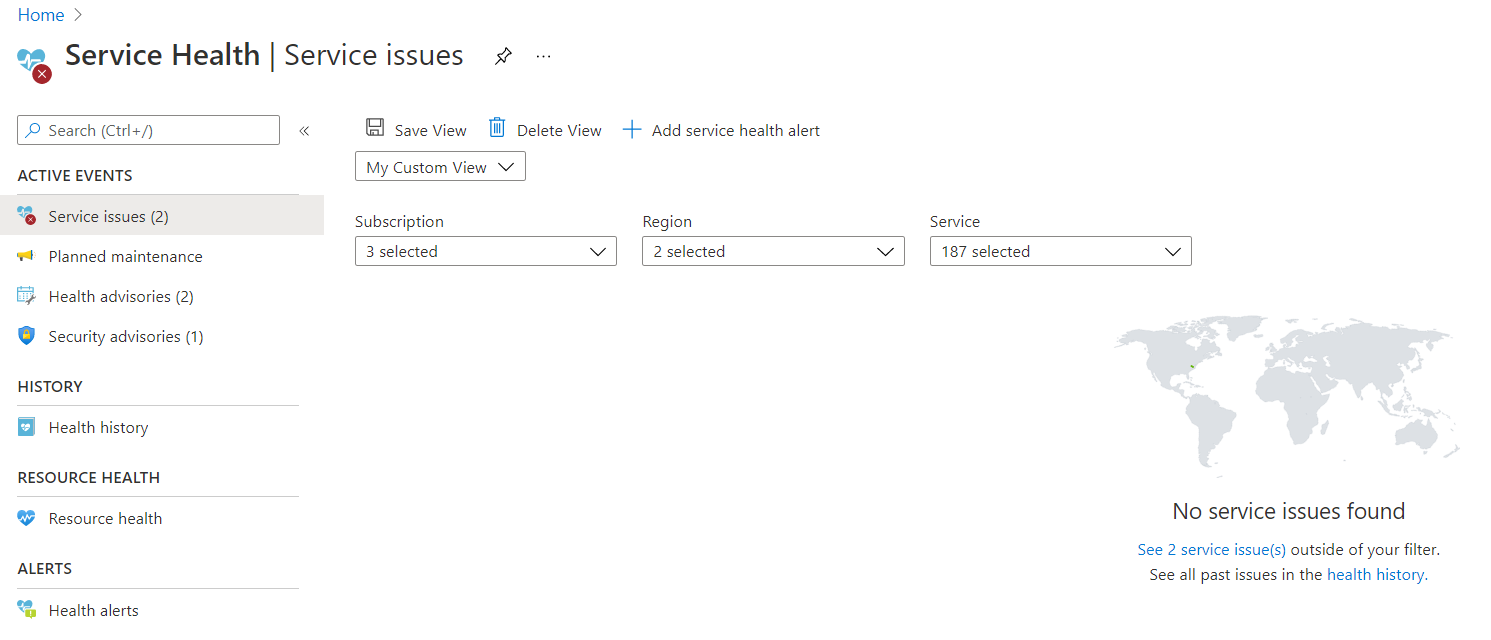
You can use Service Health to get information on outages, planned maintenance, health, and security advisories.
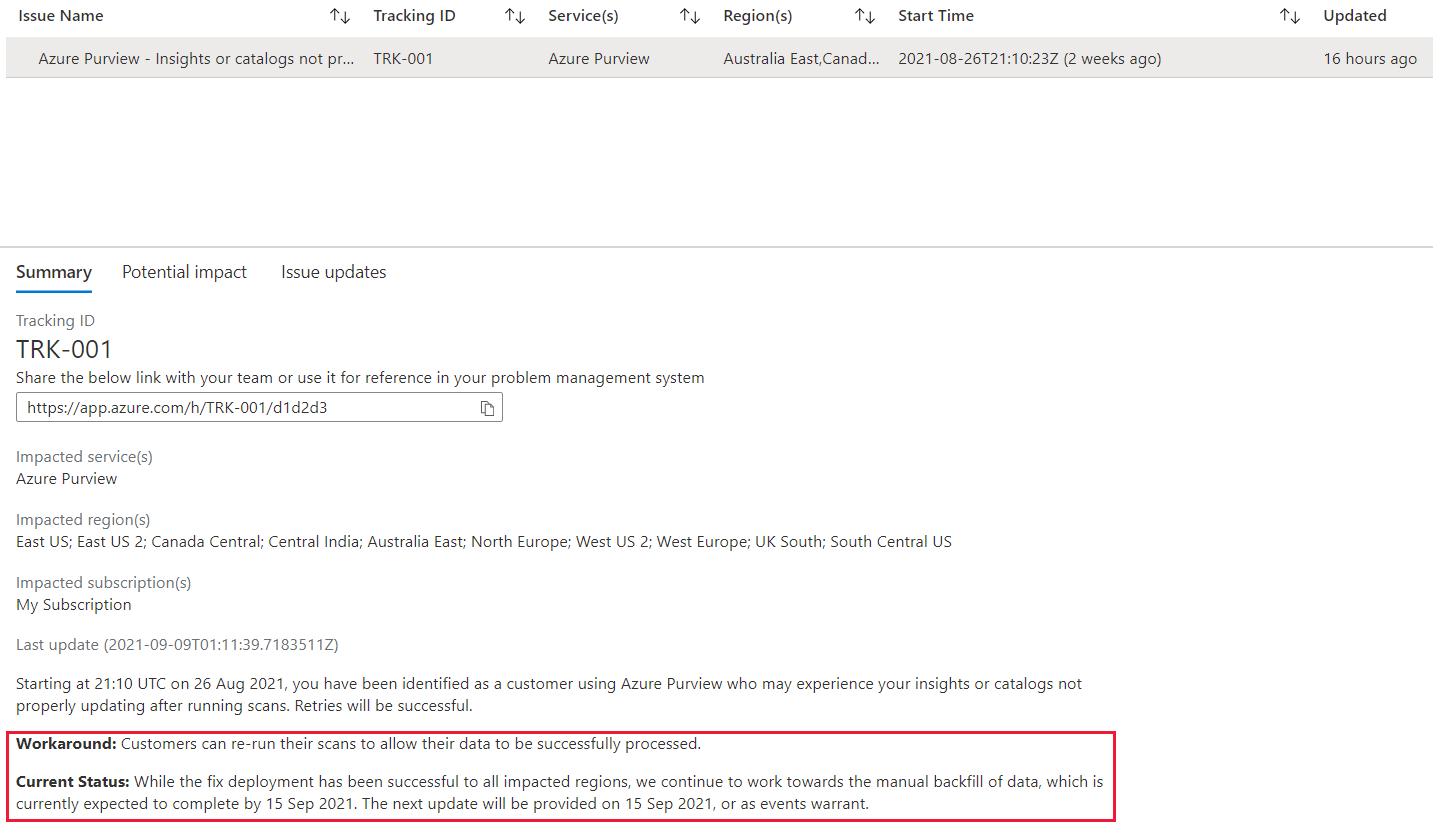
Service Health allows you to create customized views, filtering among subscription, region, and services. The level of detail includes:
- Issue Name
- Subscription, service, and region impacted
- Start time
- Summary and issue updates
- Root-cause analysis
- Downloadable PDF with explanations
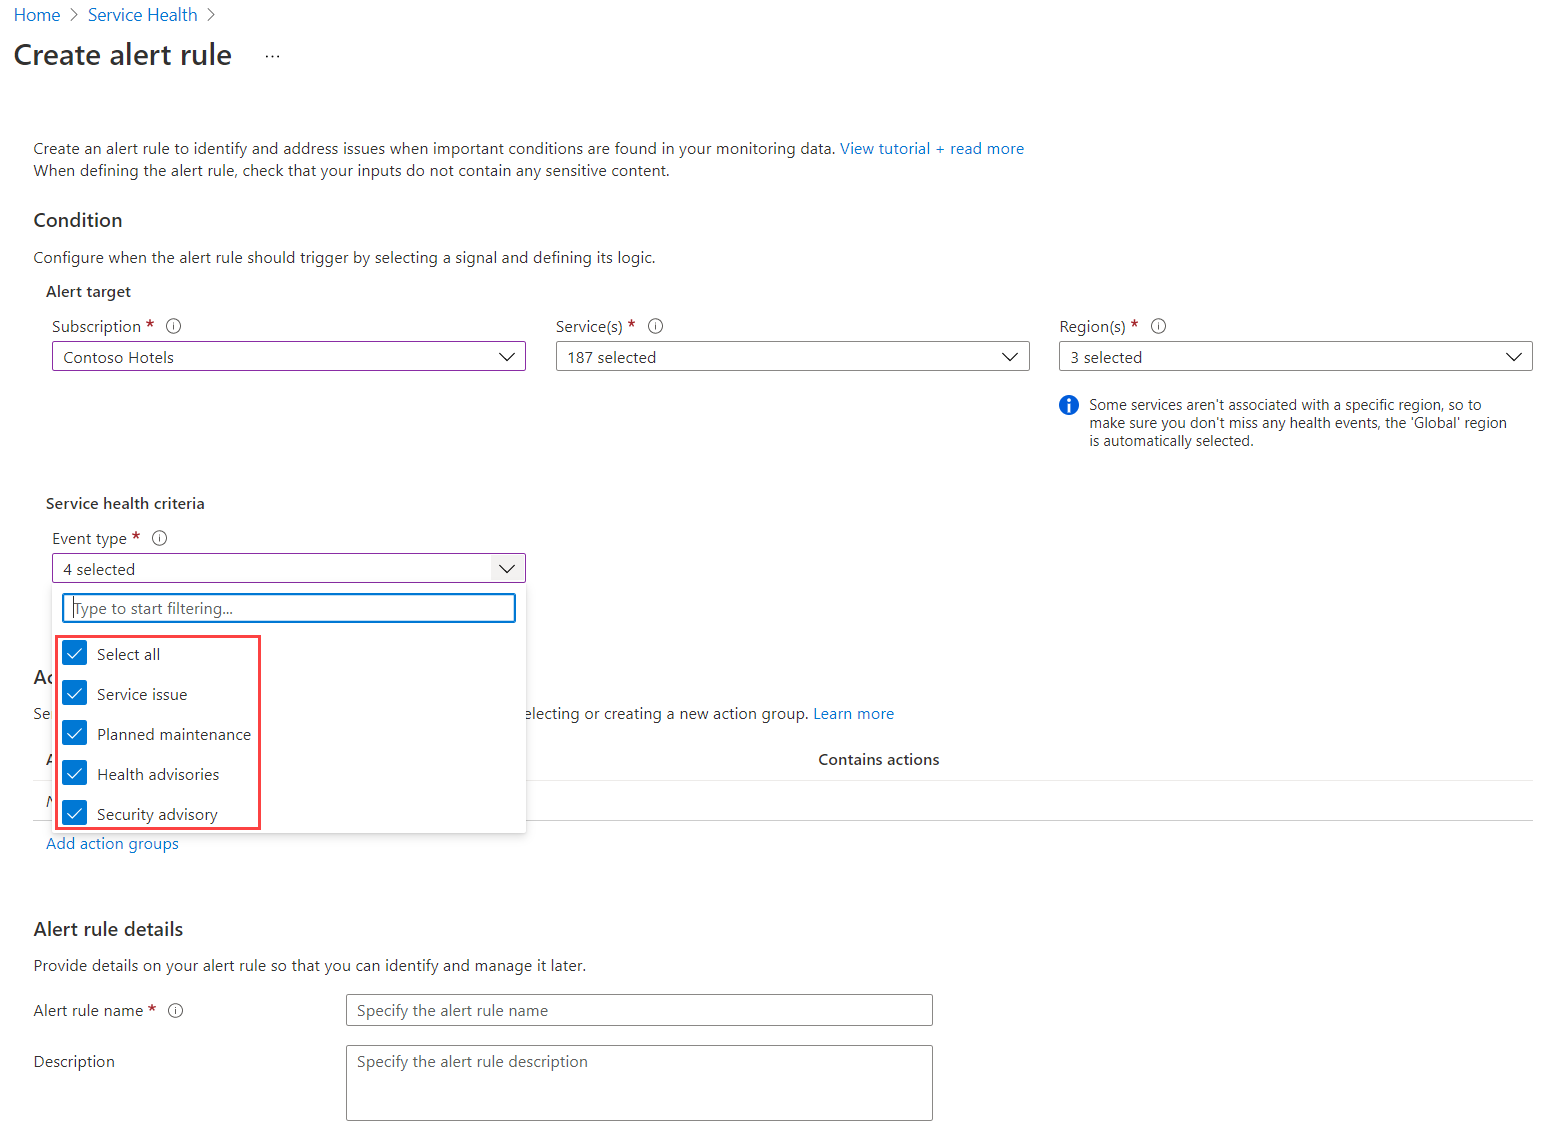
Service Health also allows you to create health alerts to notify you when something happens.
Resource Health
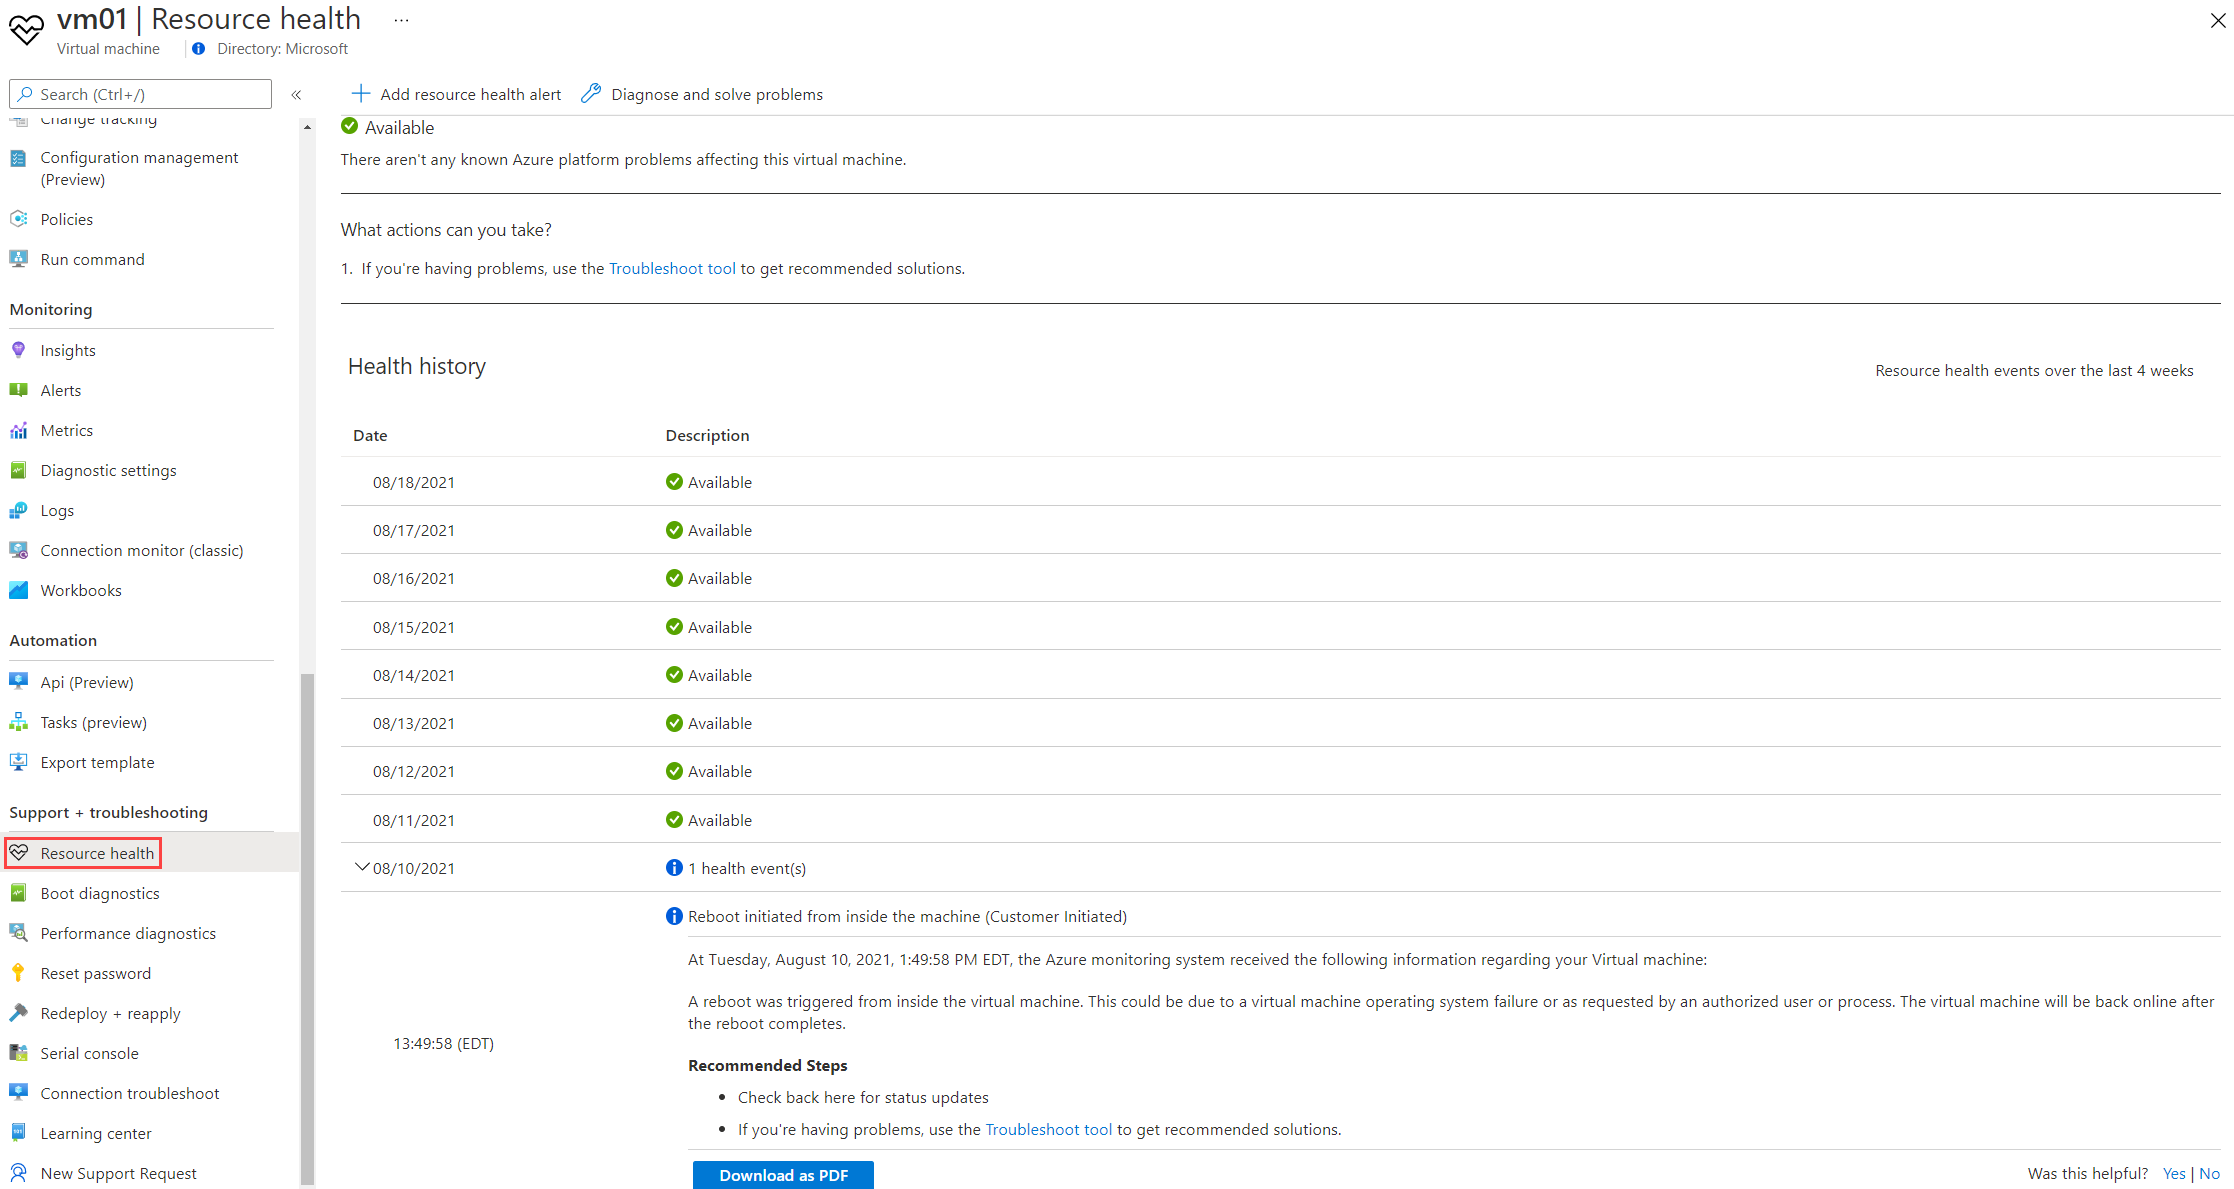
The Resource Health executes some minute-by-minute checks across the resources and makes the information available to you. There's a specific type of resource that runs the health checks. You can see the full list of resource types on this page.
As an example: for Virtual Machines, the types of checks executed include:
- Is the server hosting this virtual machine up and running?
- Has the host operating system (OS) booting completed?
- Is there ongoing planned maintenance?
- Is the host hardware degraded and predicted to fail soon?
The Resource Health is available through the Support + troubleshooting blade in the Azure portal for the specific resource types on Azure.
What are the main features of Azure Service Health?
In this section, we list the main features of Azure Service Health. We'll review some details for each one.
Personalized dashboards
With Azure Service Health, you can create a personalized dashboard (view) that allows you to filter on subscription, region, and service. Doing so allows you to customize the information available for review, based on what is more important/critical to your environment.
Configurable cloud alerts
Based on the selections you make, you can add a service health alert and choose which type of events you'd like to receive notifications about.
Shareable documents with details about issues
For any service issue, planned maintenance, health, or security advisories, you can download a PDF document containing the relevant information. By selecting the issue, you can see the summary information along with the option to download all information as a PDF document. You might find this PDF useful when you need to share the details by email, for example. Among other detailed information, the PDF contains the event type, status, service impacted, region, impacted subscriptions, update history and more.
Guidance and support during incidents
If there are incidents, you can find guidance and related information about workarounds or actions you can take to minimize impact, as well all issue updates.
Next unit: When to use Azure Service Health
Having an issue? We can help!
- For issues related to this module, explore existing questions using the #azure training tag or Ask a question on Microsoft Q&A.
- For issues related to Certifications and Exams, post on Certifications Support Forums or visit our Credentials Help.
