Monitor an Azure AI Search solution
Azure Monitor can give you insights into how well your search service is being used and performing. You can also receive alerts to proactively notify you of issues.
Here, you'll explore all the monitoring options available for Azure AI Search. Then you'll learn about useful alerts you can create to manage your search solution.
Monitor Azure AI Search in Azure Monitor
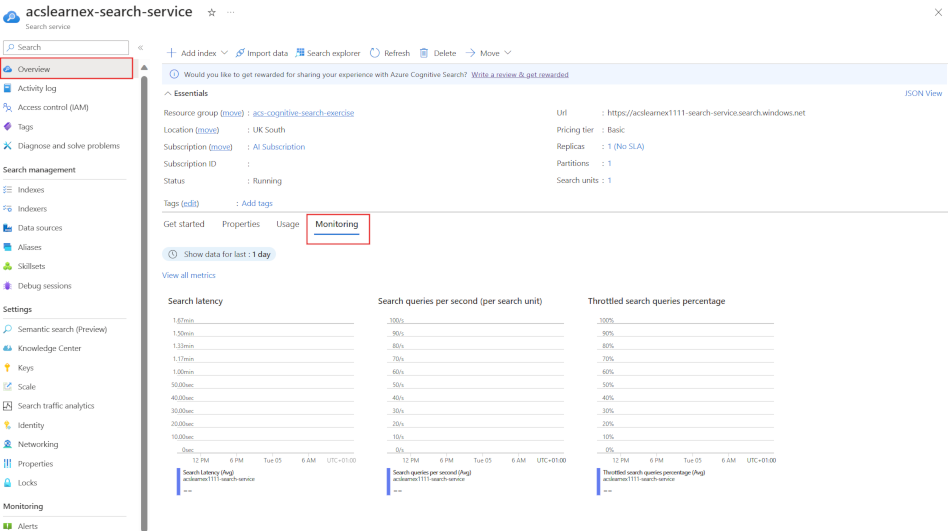
When you create your Azure AI Search service, without you doing any other setup, you can see your current search latency, queries per second, and the percentage of throttled queries. This data can be viewed on the Monitoring tab of the Overview page.
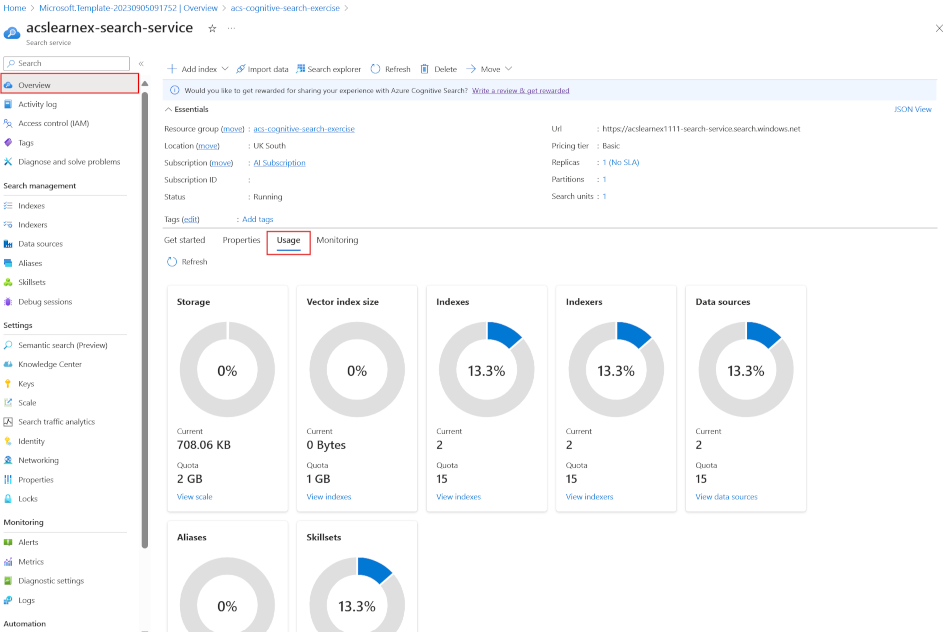
You can also check what resources your search solution is using on the Usage tab.
This basic information is a good start to monitoring, but you can go further with some more configuration. If you're familiar with supporting other resources on the Azure platform, you'll know that Azure Monitor can be used for all your Azure resources.
In fact, you've already seen how to enable Azure Monitor in the optimize performance unit. Follow those steps to allow Azure Monitor to use data captured in Log Analytics to see a full set of diagnostic data.
Once you have started using Log Analytics, you get access to performance and diagnostic data in these log tables:
- AzureActivity - Shows you tasks that have been executed like scaling the search service
- AzureDiagnostics - All the query and indexing operations
- AzureMetrics - Data used for metrics that measure the health and performance of your search service
Use metrics to see diagnostic data visually
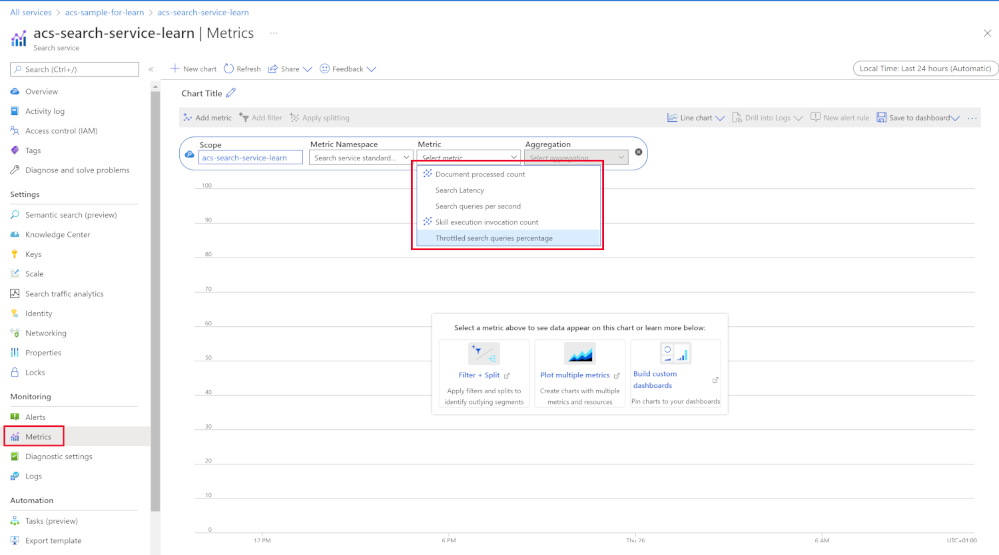
Creating charts is a powerful way to view how your search service is performing. Under the Monitoring section of your search service, select Metrics.
Now select to add any of these captured metrics:
- DocumentsProcessedCount
- SearchLatency
- SearchQueriesPerSecond
- SkillExecutionCount
- ThrottledSearchQueriesPercentage
For example, you could plot search latency against the percentage of throttled queries to see if the responses to queries are affected by throttling.
Write Kusto queries against your search solutions logs
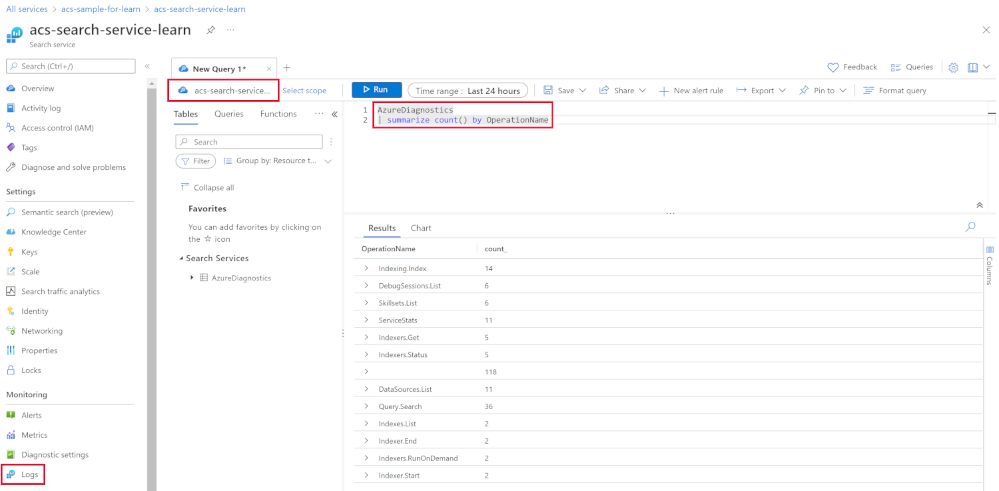
Log Analytics allows you to write any Kusto query against captured log data. The easiest way to run these queries is by selecting Logs under the Monitor section. Logs opens Log Analytics with the quest window automatically scoped to your Azure AI Search solution.
The above query lets you see a list of recent operations and how many times they happened.
AzureDiagnostics
| summarize count() by OperationName
The following are useful queries to help you monitor and diagnose issues with your search solution:
Query
Kusto
Long-running queries
AzureDiagnostics
| project OperationName, resultSignature_d, DurationMs, Query_s, Documents_d, IndexName_s
| where OperationName == "Query.Search"
| sort by DurationMs
Indexer status
AzureDiagnostics
| project OperationName, Description_s, Documents_d, ResultType, resultSignature_d
| where OperationName == "Indexers.Status"
HTTP status codes
AzureDiagnostics
| where TimeGenerated > ago(7d)
| summarize count() by resultSignature_d
| render barchart
Query rates
AzureDiagnostics
| where OperationName == "Query.Search" and TimeGenerated > ago(1d)
| extend MinuteOfDay = substring(TimeGenerated, 0, 16)
| project MinuteOfDay, DurationMs, Documents_d, IndexName_s
| summarize QPM=count(), AvgDuractionMs=avg(DurationMs), AvgDocCountReturned=avg(Documents_d)  by MinuteOfDay
| order by MinuteOfDay desc
| render timechart
Average Query Latency
let intervalsize = 1m;
let _startTime = datetime('2021-02-23 17:40');
let _endTime = datetime('2021-02-23 18:00');
AzureDiagnostics
| where TimeGenerated between(['_startTime']..['_endTime']) // Time range filtering
| summarize AverageQueryLatency = avgif(DurationMs, OperationName in ("Query.Search", "Query.Suggest", "Query.Lookup", "Query.Autocomplete"))
by bin(TimeGenerated, intervalsize)
| render timechart
Average Queries Per Minute (QPM)
let intervalsize = 1m;
let _startTime = datetime('2021-02-23 17:40');
let _endTime = datetime('2021-02-23 18:00');
AzureDiagnostics
| where TimeGenerated between(['_startTime'] .. ['_endTime']) // Time range filtering
| summarize QueriesPerMinute=bin(countif(OperationName in ("Query.Search", "Query.Suggest", "Query.Lookup", "Query.Autocomplete"))/(intervalsize/1m), 0.01)
by bin(TimeGenerated, intervalsize)
| render timechart
Indexing Operations Per Minute (OPM)
let intervalsize = 1m;
let _startTime = datetime('2021-02-23 17:40');
let _endTime = datetime('2021-02-23 18:00');
AzureDiagnostics
| where TimeGenerated between(['_startTime'] .. ['_endTime']) // Time range filtering
| summarize IndexingOperationsPerSecond=bin(countif(OperationName == "Indexing.Index")/ (intervalsize/1m), 0.01)
by bin(TimeGenerated, intervalsize)
| render timechart
Create alerts to be notified about common search solution issues
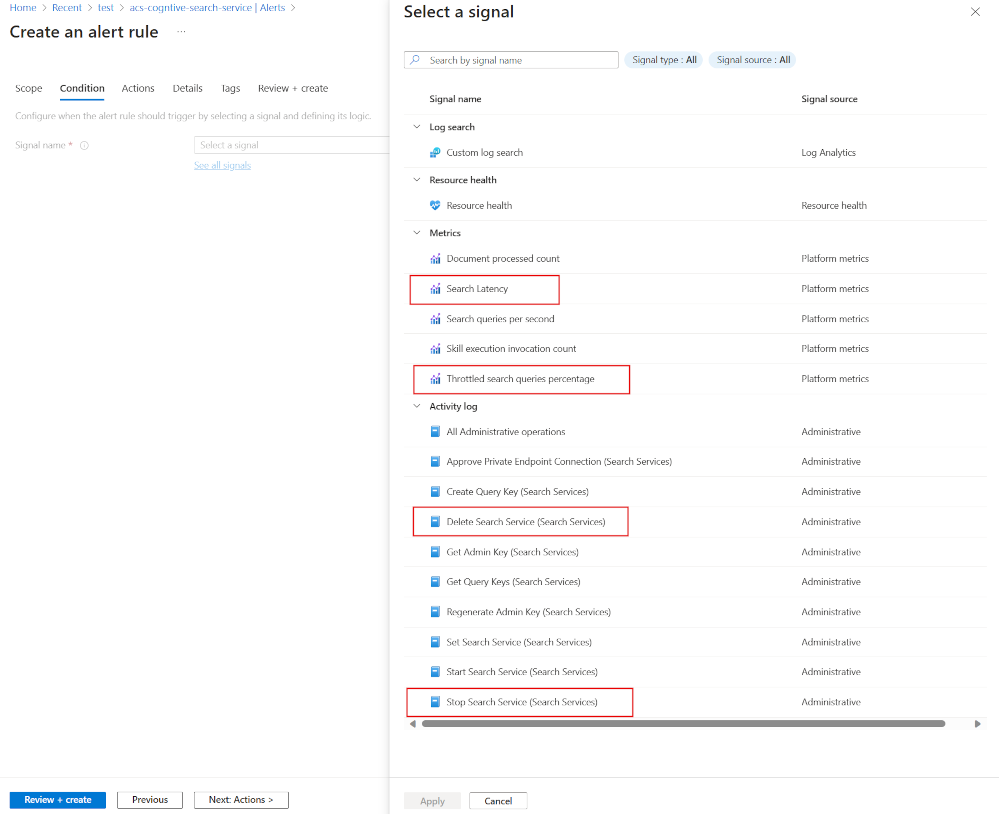
Alerts can let you proactively manage your search service. Here are some commonly used alerts you should consider creating:
- Search Latency using the metric signal, you can specify what latency triggers the alert in seconds
- Throttled search percentage using the metric signal, you can specify the percentage
- Delete Search Service using the activity log signal, be notified if your search service is deleted
- Stop Search Service using the activity log signal, be notified if your search service is stopped which happens if your search service is scaled up or down or needs to be restarted
