Evaluate the Responsible AI dashboard
When your Responsible AI dashboard is generated, you can explore its contents in the Azure Machine Learning studio to evaluate your model.
When you open the Responsible AI dashboard, the studio tries to automatically connect it to a compute instance. The compute instance provides the necessary compute for interactive exploration within the dashboard.
The output of each component you added to the pipeline is reflected in the dashboard. Depending on the components you selected, you can find the following insights in your Responsible AI dashboard:
- Error analysis
- Explanations
- Counterfactuals
- Causal analysis
Let's explore what we can review for each of these insights.
Explore error analysis
A model is expected to make false predictions, or errors. With the error analysis feature in the Responsible AI dashboard, you can review and understand how errors are distributed in your dataset. For example, are there specific subgroups, or cohorts, in your dataset for which the model makes more false predictions?
When you include error analysis, there are two types of visuals you can explore in the Responsible AI dashboard:
- Error tree map: Allows you to explore which combination of subgroups results in the model making more false predictions.
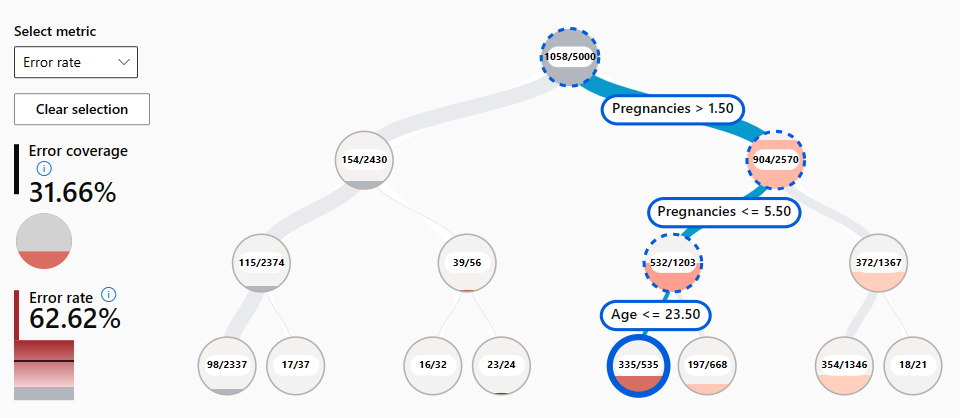
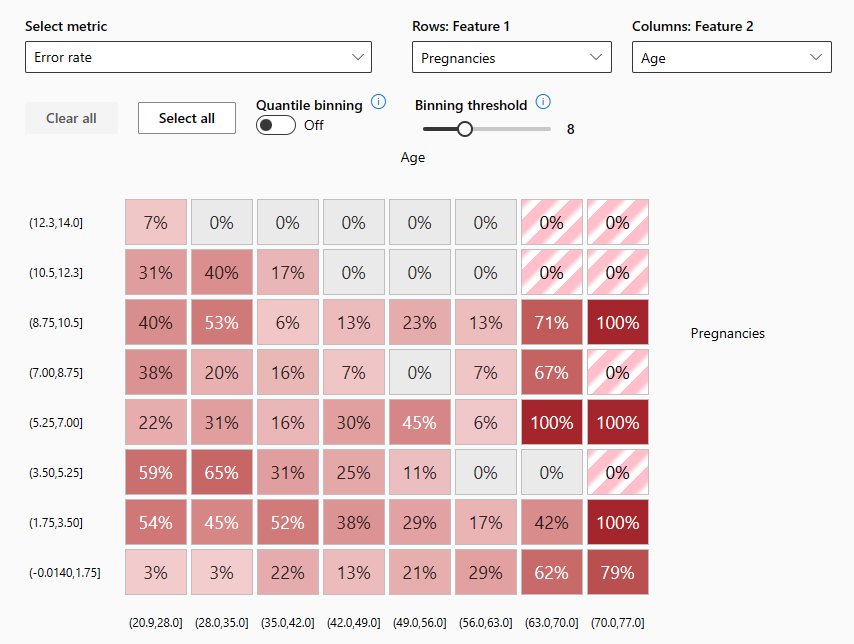
- Error heat map: Presents a grid overview of a model's errors over the scale of one or two features.
Explore explanations
Whenever you use a model for decision-making, you want to understand how a model reaches a certain prediction. Whenever you've trained a model that is too complex to understand, you can run model explainers to calculate the feature importance. In other words, you want to understand how each of the input features influences the model's prediction.
There are various statistical techniques you can use as model explainers. Most commonly, the mimic explainer trains a simple interpretable model on the same data and task. As a result, you can explore two types of feature importance:
- Aggregate feature importance: Shows how each feature in the test data influences the model's predictions overall.
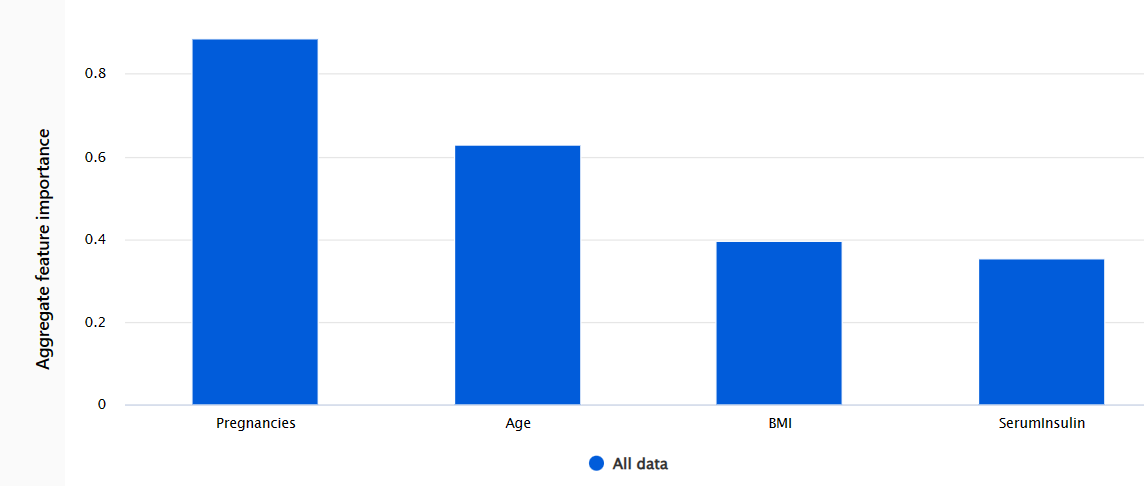
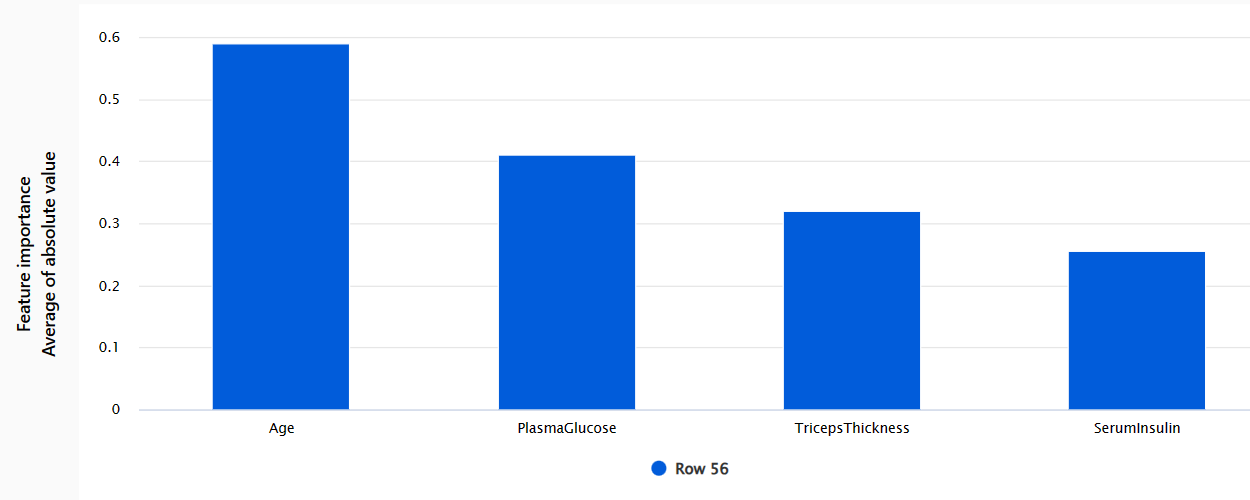
- Individual feature importance: Shows how each feature impacts an individual prediction.
Explore counterfactuals
Explanations can give you insights into the relative importance of features on the model's predictions. Sometimes, you may want to take it a step further and understand whether the model's predictions would change if the input would be different. To explore how the model's output would change based on a change in the input, you can use counterfactuals.
You can choose to explore counterfactuals what-if examples by selecting a data point and the desired model's prediction for that point. When you create a what-if counterfactual, the dashboard opens a panel to help you understand which input would result in the desired prediction.
Explore causal analysis
Explanations and counterfactuals help you to understand the model's predictions and the effects of features on the predictions. Though model interpretability may already be a goal by itself, you may also need more information to help you improve decision-making.
Causal analysis uses statistical techniques to estimate the average effect of a feature on a desired prediction. It analyzes how certain interventions or treatments may result in a better outcome, across a population or for a specific individual.
There are three available tabs in the Responsible AI dashboard when including causal analysis:
- Aggregate causal effects: Shows the average causal effects for predefined treatment features (the features you want to change to optimize the model's predictions).
- Individual causal effects: Shows individual data points and allows you to change the treatment features to explore their influence on the prediction.
- Treatment policy: Shows which parts of your data points benefit most from a treatment.