Monitor health and alerts in Azure Stack Hub
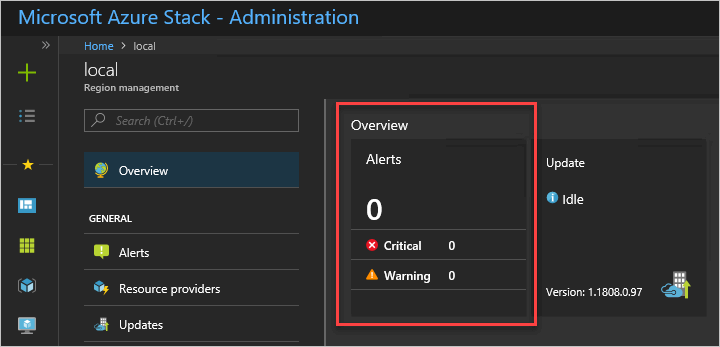
Azure Stack Hub includes infrastructure monitoring capabilities that help you view health and alerts for an Azure Stack Hub region. The Region management tile lists all the deployed regions of Azure Stack Hub. It's pinned by default in the administrator portal for the Default Provider Subscription. The tile shows the number of active critical and warning alerts for each region. The tile is your entry point into the health and alert functionality of Azure Stack Hub.
Understand health in Azure Stack Hub
The health resource provider manages health and alerts. Azure Stack Hub infrastructure components register with the health resource provider during Azure Stack Hub deployment and configuration. This registration enables the display of health and alerts for each component. Health in Azure Stack Hub is a simple concept. If alerts for a registered instance of a component exist, the health state of that component reflects the worst active alert severity: warning or critical.
Alert severity definition
Azure Stack Hub raises alerts with only two severities: warning and critical.
- Warning An operator can address the warning alert in a scheduled manner. The alert typically doesn't impact user workloads.
- Critical An operator should address the critical alert with urgency. These alerts indicate issues that currently impact or will soon impact Azure Stack Hub users.
View and manage component health state
You can view the health state of components in the administrator portal and through REST API and PowerShell.
To view the health state in the portal, click the region that you want to view in the Region management tile. You can view the health state of infrastructure roles and of resource providers.
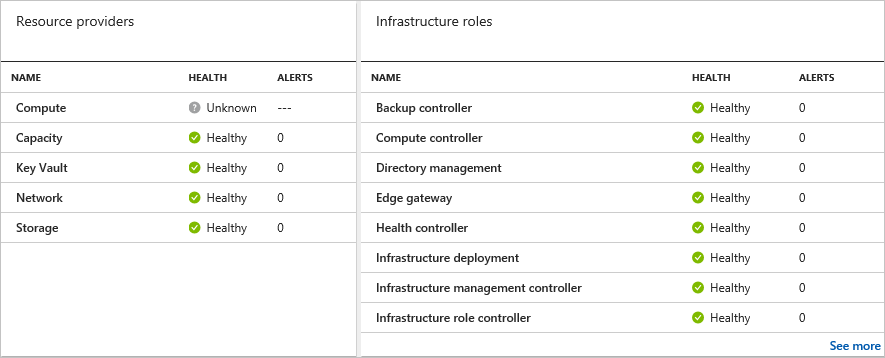
You can click a resource provider or infrastructure role to view more detailed information.
View alerts
The list of active alerts for each Azure Stack Hub region is available directly from the Region management blade. The first tile in the default configuration is the Alerts tile, which displays a summary of the critical and warning alerts for the region. You can pin the Alerts tile, like any other tile on this blade, to the dashboard for quick access.
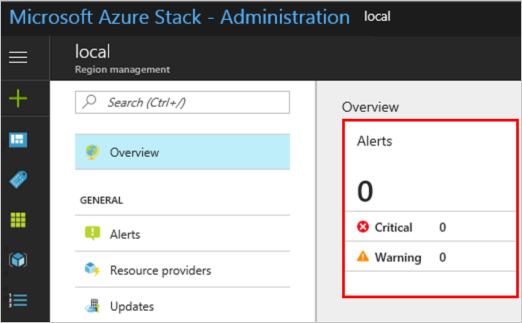
To view a list of all active alerts for the region, select the top part of the Alerts tile. To view a filtered list of alerts (Critical or Warning), select either the Critical or Warning line item within the tile.
The Alerts blade supports the ability to filter both on status (Active or Closed) and severity (Critical or Warning). The default view displays all active alerts. All closed alerts are removed from the system after seven days.
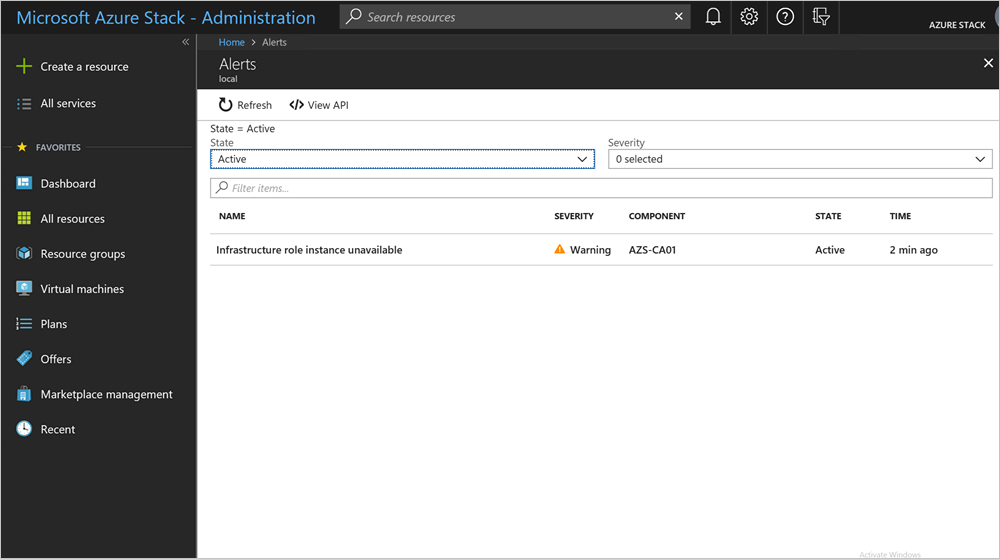
The View API action displays the REST API that was used to generate the list view. This action provides a quick way to become familiar with the REST API syntax that you can use to query alerts. You can use this API in automation or for integration with your existing datacenter monitoring, reporting, and ticketing solutions.
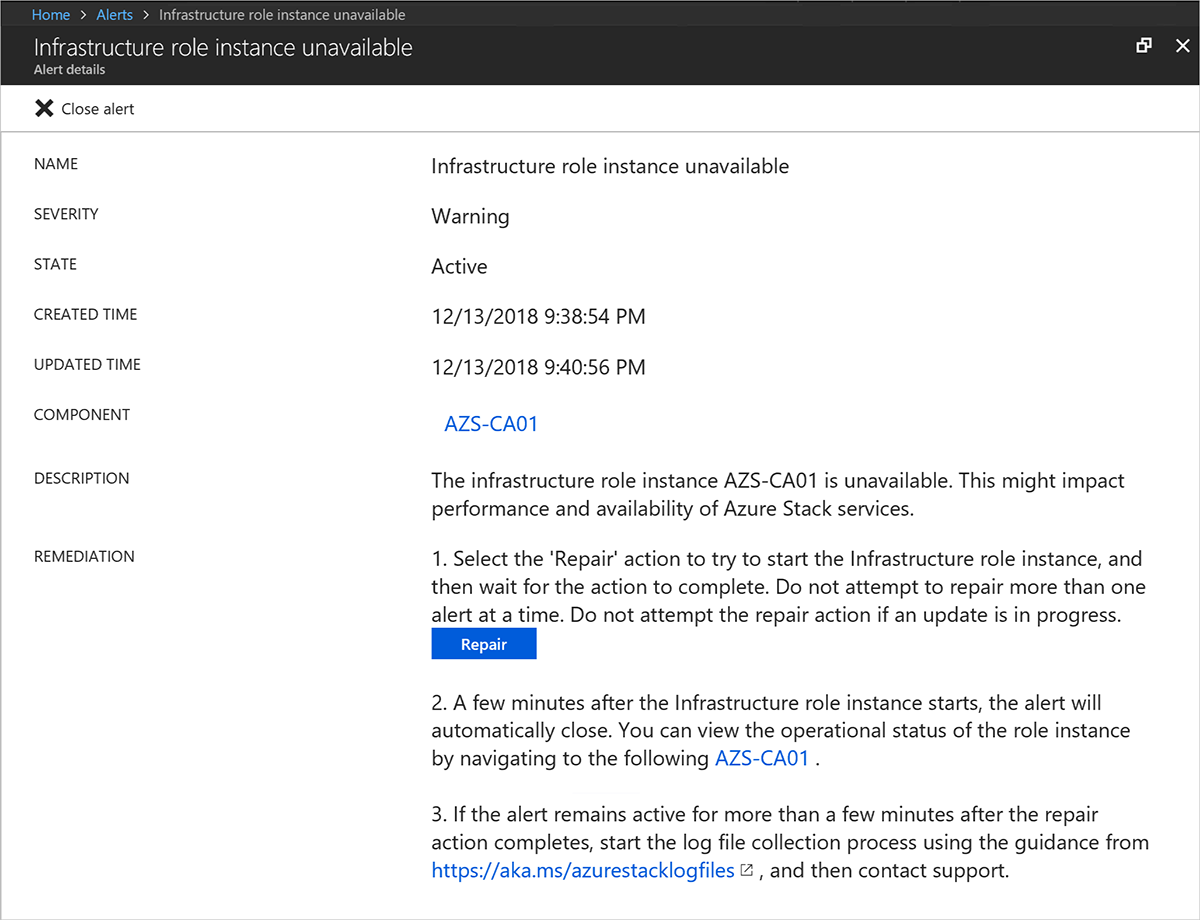
You can click a specific alert to view the alert details. The alert details show all fields that are associated with the alert and enable quick navigation to the affected component and source of the alert. For example, the following alert occurs if one of the infrastructure role instances goes offline or isn't accessible.