Monitor the migration
One of the most important components of a VLDB migration is the monitoring, logging, and diagnostics that are configured during Development, Test and “dry run” migrations.
Deployment of the required monitoring and interpretation of the monitoring and diagnostic results after each test cycle is mandatory and essential for optimizing the migration and planning production cutover. The results gained in test migrations are also necessary to be able to judge whether the actual production migration is following the same patterns and timelines as the test migrations. Customers should request regular project review checkpoints with the SAP partner. Contact Microsoft for a list of consultants that have demonstrated the technical and organizational skills required for a successful project.
Without comprehensive monitoring and logging, it would be almost impossible to achieve safe, repeatable, consistent, and low downtime migrations with a guarantee of no data loss. If problems such as long runtimes of some packages were to occur, it is almost impossible for Microsoft and/or SAP to assist with spot consulting without monitoring data and migration design documentation.
During the runtime of an OS/DB migration, monitor the following items:
- OS level parameters on DB and R3load hosts: CPU per thread, Kernel time per thread, Free Memory (GB), Page in/sec, Page out/sec, Disk IO reads/sec, Disk IO write/sec, Disk read KB/sec, Disk write KB/sec
- DB level parameters on SQL Server target: BCP rows/sec, BCP KB/sec, Transaction Log %, Memory Grants, Memory Grants pending, Locks, Lock memory, locking/blocking
- Network monitoring: This is normally handled by the network team. Exact configuration of network monitoring depends on the customer-specific situation.
During the runtime of the DB import, it is recommended to execute the following SQL statement every few minutes and document anything abnormal (such as high wait times).
select session_id, request_id,start_time, status, command, wait_type, wait_resource, wait_time, last_wait_type, blocking_session_id from sys.dm_exec_requests
where session_id >49 orderby wait_time desc;
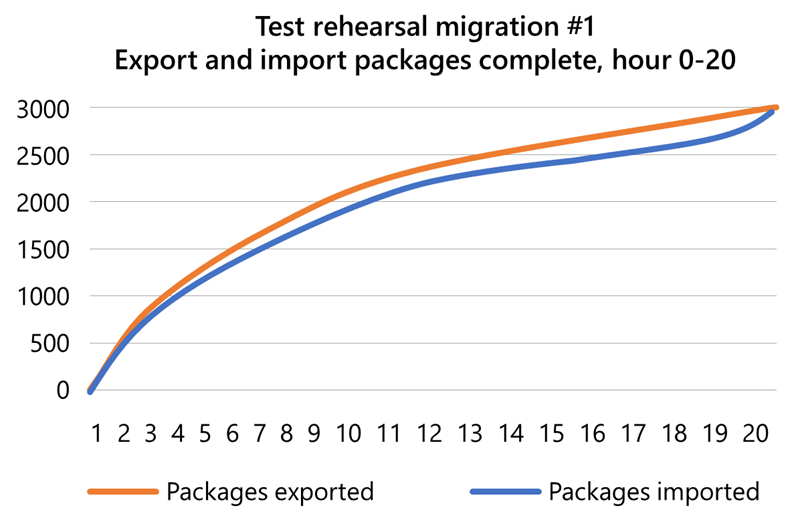
During all migration test cycles, a “Flight Plan” showing the number of packages exported and imported (y-axis) should be plotted against time (x-axis). The purpose of this graph is to establish an expected rate of progress during the final production migration cutover. Deviation (either positive or negative) from the expected “Flight Plan” during test or the final production migration is easily detected using this method. Other parameters such as CPU, disk and R3load rows/sec can be overlaid on top of the “Flight Plan”.
At the conclusion of the export and import, the migration time reports must be collected (export_time.html and import_time.html).