Troubleshoot app performance by using Application Map
Application Map helps you spot performance bottlenecks or failure hotspots across all components of your distributed application. Each node on the map represents an application component or its dependencies; and has health key performance indicator and alerts status. You can select through from any component to more detailed diagnostics, such as Application Insights events. If your app uses Azure services, you can also select through to Azure diagnostics, such as SQL Database Advisor recommendations.
Components are independently deployable parts of your distributed/microservices application. Developers and operations teams have code-level visibility or access to telemetry generated by these application components.
- Components are different from "observed" external dependencies such as SQL, Event Hubs, etc. which your team/organization may not have access to (code or telemetry).
- Components run on any number of server/role/container instances.
- Components can be separate Application Insights instrumentation keys (even if subscriptions are different) or different roles reporting to a single Application Insights instrumentation key. The preview map experience shows the components regardless of their configuration.
You can see the full application topology across multiple levels of related application components. Components could be different Application Insights resources, or different roles in a single resource. The app map finds components by following HTTP dependency calls made between servers with the Application Insights SDK installed.
This experience starts with progressive discovery of the components. When you first load the application map, a set of queries is triggered to discover the components related to this component. A button at the top-left corner updates with the number of components in your application as they're discovered.
Selecting Update map components refreshes with all components discovered until that point. Depending on the complexity of your application, this may take a minute to load.
If all of the components are roles within a single Application Insights resource, then this discovery step isn't required. The initial load for such an application has all its components.
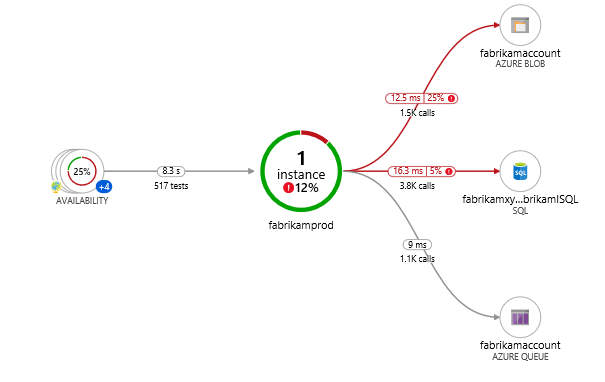
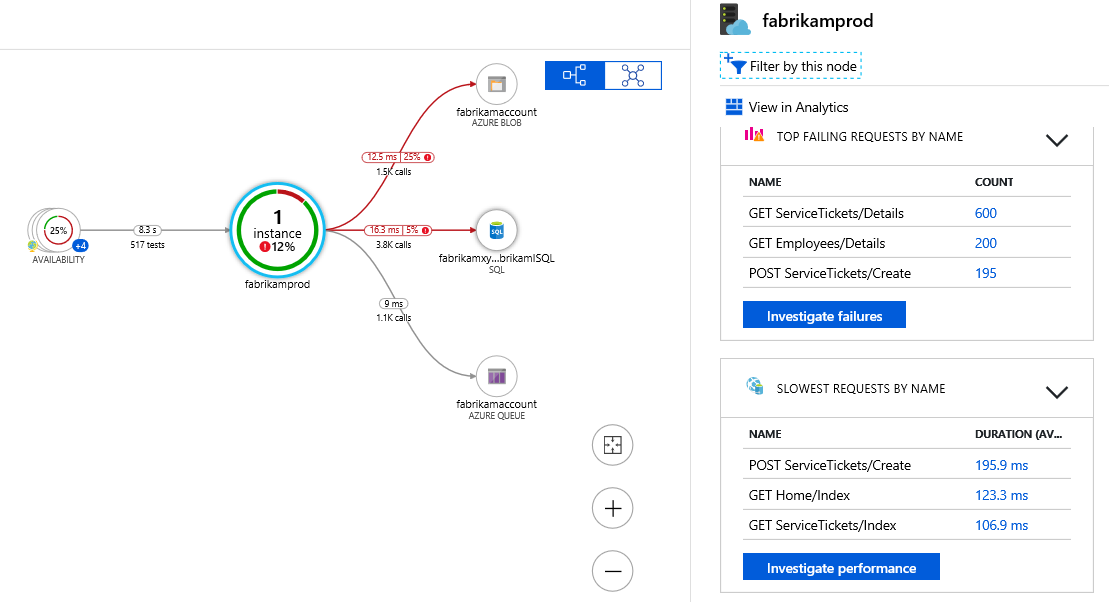
One of the key objectives with this experience is to be able to visualize complex topologies with hundreds of components. Click on any component to see related insights and go to the performance and failure triage experience for that component.
Application Map uses the cloud role name property to identify the components on the map. You can manually set or override the cloud role name and change what gets displayed on the Application Map.