Report on and troubleshoot Teams calls with Call Quality Dashboard
Call Quality Dashboard (CQD), available as link from Teams admin center or at https://cqd.teams.microsoft.com reports on Teams call and meeting quality, at an organizational level.
Microsoft provides two curated CQD templates are provided: one is for managing all networks and the other is filtered for managed (internal) networks only. These are useful to review regularly.
This tool is for those focused on call and meeting usage and performance, particularly for those interested in device usage and network performance. With CQD, you can look at patterns and trends in issues and use them to improve performance and user experience. CQD has both web-based reports and an excellent Power BI report pack.
To make the most of CQD, you should both upload your network data and install the Power BI reports.
Metrics to review regularly in Call Quality Dashboard
A Voice Administrator should look at the call failures across the entire environment. This can be done by reviewing the Microsoft Call Quality Dashboard
Most user problems can be grouped into the following categories:
Incomplete firewall or proxy configuration
Poor Wi-Fi coverage
Insufficient bandwidth
Using VPNs
Inconsistent or outdated client versions and drivers
Unoptimized or built-in audio devices
Problematic subnets or network devices
There are three key service metrics in CQD to review regularly, which are shown below:
| Metric | Description |
|---|---|
| Poor Stream Rate (PSR) | The poor stream rate (PSR) represents the organization's overall percentage of streams that have poor quality. This metric is meant to highlight areas where your organization can concentrate effort to have the strongest impact toward reducing this value and improving the user experience. |
| Setup Failure Rate | The setup failure rate, otherwise known as the Total Call Setup Failure Percentage measurement in CQD, is the number of streams where the media path couldn't be established between the endpoints at the start of the call. This represents any media stream that couldn't be established. Given the severity of the impact of this problem on the user experience, the goal is to reduce this value to as close to zero as possible. A high value for this metric is more common in new deployments with incomplete firewall rules than a mature deployment, but it's still important to watch regularly. |
| Drop Failure Rate | The drop failure rate, otherwise known as the Total Call Dropped Failure Percentage measurement in CQD, is the percentage of successfully established streams where the media path didn't terminate normally. This represents any media stream that terminated unexpectedly. Although the impact of this isn't as severe as a stream that failed to set up, it still negatively affects the user experience. Sudden and frequent media drops can have a severe impact on the user experience, resulting in the need for users to reconnect, resulting in lost productivity. |
Configure tenant, endpoint building data for Call Quality Dashboard
CQD has several reports that can map performance to specific networks and locations with friendly names like "London Office-" these are called " Location-Enhanced Reports." It can also report on specific endpoints by friendly names: For example, if you have asset numbers for laptops or want to report my laptop make and model.
Both abilities require you to upload information to CQD; so, it can map the information it gathers to your friendly names.
To enable Location-Enhanced Reports, download the template CSV or TSV template from Microsoft doc, see Reference links. This is the same template that is used for the Call Analytics reports but is uploaded in a different place for CQD. Once the template is complete, from the CQD Summary Reports dashboard (https://cqd.teams.microsoft.com), select Tenant Data Upload from the CQD Settings gear icon then "Tenant Data Upload."
To enable reports to show endpoint makes, models and friendly names you must upload another CSV or TSV (either work) to the same place.
Configure CQD Power BI query templates for Call Quality Dashboard
While CQD has web-based reports right out of the box, there are also some great Power BI templates. The templates cover the following report areas:
Teams Auto Attendant & Call Queue Historical Report
Helpdesk Report
Location Enhanced Report
Mobile Device Report
PSTN Direct Routing Report
Summary Report
Teams Utilization Report
Note
The Microsoft Call Quality connector and Power BI reports only supports DirectQuery in Power BI; Import mode is not supported.
To set up the Power BI templates and create a new PowerBI.com workspace to host the Power BI reports, follow these steps:
Navigate to Power BI at https://PowerBI.com.
Sign in with an account with the Teams Administrator role and a Power BI Pro license.
Select Workspaces and Create a workspace.
Enter a workspace name and a suitable description.
Select Save
Continue with the following steps to create the new template:
Download the CQD Power BI Query Templates from Microsoft (link in the references)
Extract the ZIP file to a folder on your local PC such as C:\PowerBITemplates
Install Microsoft Power BI Desktop on your PC (link in references)
Check to see if your computer already has a [Documents]\Power BI Desktop\Custom Connectors folder. If not, create this folder
Copy the MicrosoftCallQuality.pqx file included in the download and place it in the Custom Connectors directory.
Run Power BI Desktop.
In the top right of Power BI Desktop, select Sign in.
Sign in with the same account used for the Power BI website.
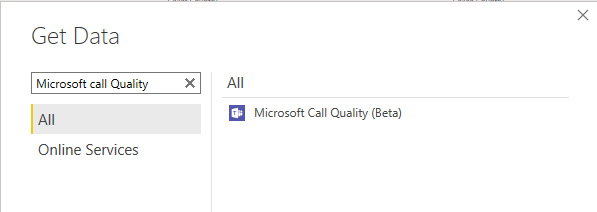
Press Get data on the Power BI Desktop Menu bar.
Enter Microsoft Call Quality and verify the Microsoft Call Quality (Beta) connector is available.
Select Cancel.
For each Power BI report template, the .pbit files in the CQD Power BI Query Templates download, perform the following steps:
Run Power BI Desktop and ensure you're signed in with the account from before.
Open the first pbit file in Power BI desktop.
Power BI Desktop will prompt you to sign in to “Microsoft Call Quality”
Select Sign in and provide your sign-in credentials. This must be the account with CQD access and the account that created the Power BI workspace.
The dialog will say “You are currently signed in,” once it does select Connect.
The report will now populate with your CQD data.
Select File and Publish.
You'll be prompted to save the file as a .pbix file, this is no longer a template, it's now a populated file
You'll be prompted to select a PowerBI.com workspace, and select the one you created.
The report will now upload, wait for it to say success.
You can now select Got it.
The report is now uploaded to the PowerBI.com workspace, you can access it by going to PowerBI.com > Workspaces > The workspace and selecting the report.
Repeat the steps for all the reports.
Tip
Power BI makes you save the file before uploading it, once uploaded these local files are no longer needed. They contain sensitive data so ensure they are deleted as appropriate.