Interpret Microsoft Adoption Score
Adoption Score supports the journey to digital transformation with insights about how your organization uses Microsoft 365 and the technology experiences that support it. Your organization's score reflects people and technology experience measurements and can be compared to benchmarks from organizations similar in size to yours.
Adoption Score includes data from Exchange, SharePoint, OneDrive, Teams, Word, Excel, PowerPoint, OneNote, Outlook, Yammer, and Skype. You can access the Adoption Score from the Microsoft 365 admin center > Reports > Adoption Score.
It provides:
- Metrics to help you see where you are on your digital transformation journey.
- Insights about the data to help you identify opportunities to improve productivity and satisfaction in your organization.
- Recommended actions you can take to help your organization use Microsoft 365 products efficiently.
The metrics, insights, and recommendations cover two areas:
People experiences - Quantifies how the organization works using Microsoft 365 categories like content collaboration, mobility, communication, meetings, and teamwork.
Technology experiences - Your organization depends on reliable and well-performing technology, and the efficient use of Microsoft 365.
Prerequisites
- For people experiences data, you need a Microsoft 365 for business or Office 365 for enterprise subscription.
- For endpoint analytics data for your tenant, you need to add Microsoft Intune to your subscription.
- Required roles to access the Adoption Score
- Global admin
- Exchange admin
- SharePoint admin
- Skype for Business admin
- Teams admin
- Global Reader
- Reports Reader
- Usage Summary Reports Reader
Interpret organization's Adoption Score
The Adoption Score home page shows your organization's total score and score history and the primary insight for each category.
Your organization's score is shown as a percent value and in points. You can see your points in the numerator and the maximum possible points in the denominator.
Peer benchmarks allow you to compare your organization's score with organizations like yours. The peer benchmark for the people experiences categories is calculated as the average of measures within a set of similar organizations. The set of organizations is composed of organizations in your region with a similar number of licensed users, types of licenses, industry, and tenure with Microsoft 365.
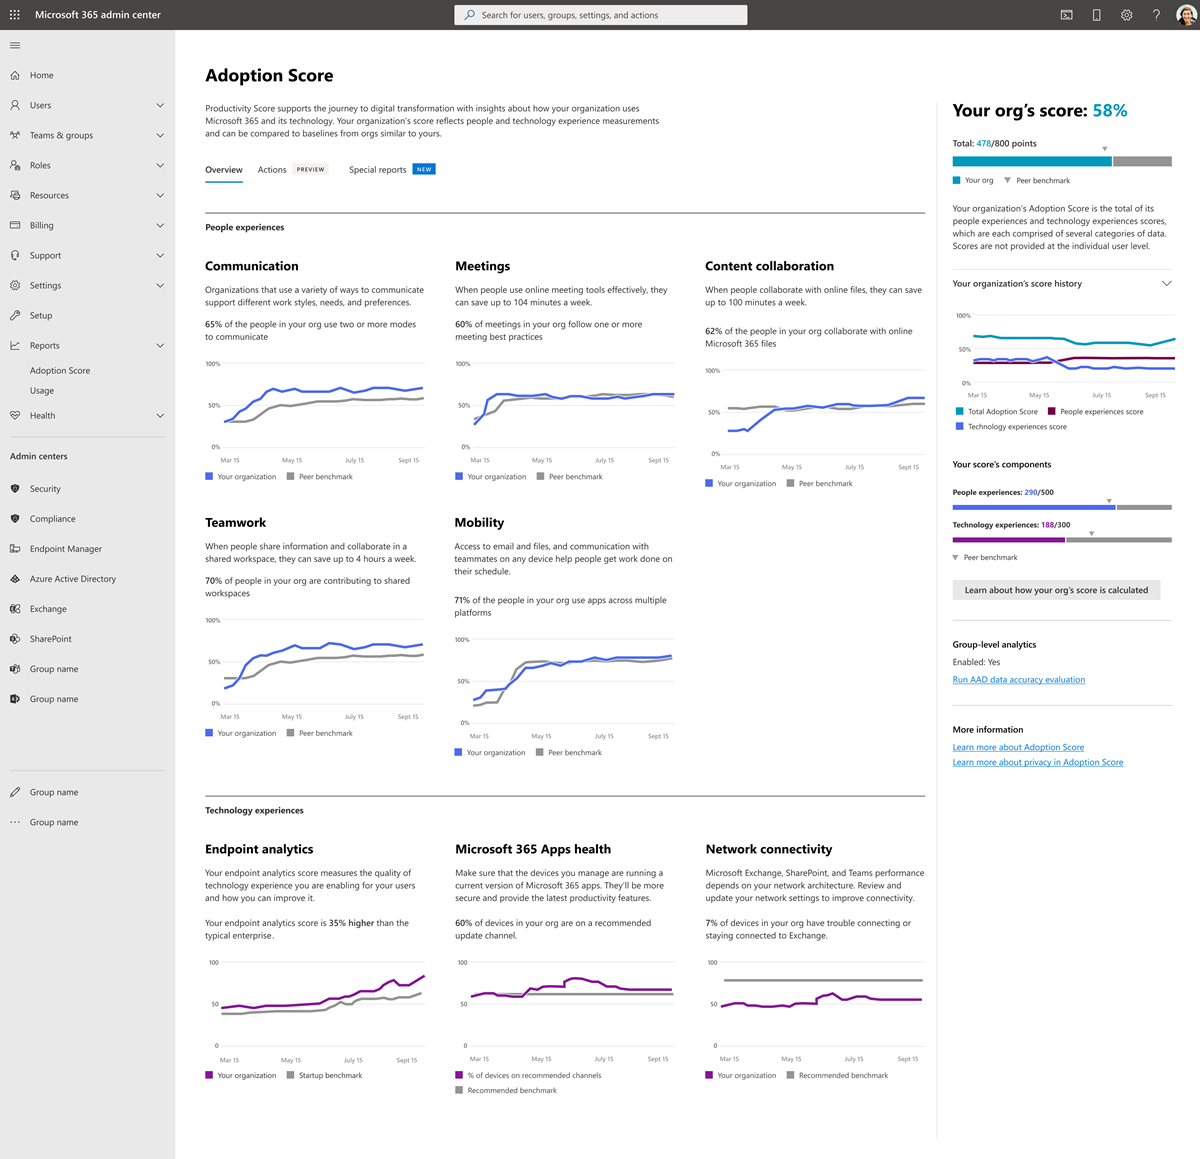

Your Adoption Score is based on the combined scores of your people and technology experiences categories. Each category is weighted equally, with a total of 100 points. The highest possible Adoption Score is 800. Your organization's score is updated daily and reflects user actions completed in the last 28 (including the current day).
In each score category, Microsoft quantifies the key indicators for how your organization is using Microsoft 365 in its journey towards digital transformation. Microsoft provides 28-day and 180-day views of the key activities.
| Categories | Score | Area | Required licensing | Key indicators |
|---|---|---|---|---|
| Content collaboration | 100 points | People experiences | OneDrive for Business SharePoint Exchange Online |
The primary insight contains information from everyone who can use OneDrive for Business and SharePoint. Additionally it breaks down the details about how many people read, create, and collaborate on content stored in OneDrive for Business and SharePoint. |
| Communication | 100 points | People experiences | Microsoft Teams Yammer Exchange Online |
The primary insight provides a measure of people in your org that are using multiple modes to communicate. |
| Meetings | 100 points | People experiences | Microsoft Teams | The primary insight looks at all Microsoft Teams online meetings that were held in your organization. The Primary insight also tracks how many meetings follow at least one of the best practices for Teams meetings. |
| Mobility | 100 points | People experiences | Microsoft Teams Exchange Online Word Excel PowerPoint OneNote |
Microsoft 365 lets people work flexibly across apps, including Microsoft Outlook, Word, Excel, PowerPoint, OneNote, Microsoft Teams, Yammer, and Skype for Business. The primary insight looks at the products that are enabled for people in your organization – and how many of these people are active on at least two platforms. |
| Teamwork | 100 points | People experiences | Microsoft Teams SharePoint Exchange Online |
The primary insight looks at all the people who are communicating using email and messages on Microsoft Teams, and interacting with content on the cloud in shared workspaces. |
| Endpoint analytics | 100 points | Technology experiences | Microsoft Intune | Insights about device setup and startup times. |
| Network connectivity | 100 points | Technology experiences | - | An aggregate of many network performance metrics, including TCP latency, download speed, and UDP connection quality metrics. |
| Microsoft 365 Apps Health | 100 points | Technology experiences | - | The primary insight is calculated from devices that are running Microsoft 365 Apps on recommended updated channel. |
Explore Teams supporting metrics
Each category details page shows the primary insight and supporting metrics as well as related research and actions you can take to drive change in your organization. Though these extra metrics don't directly influence your Adoption Score, but can help you create an action plan as a part of your digital transformation.
The following categories include data from Teams.
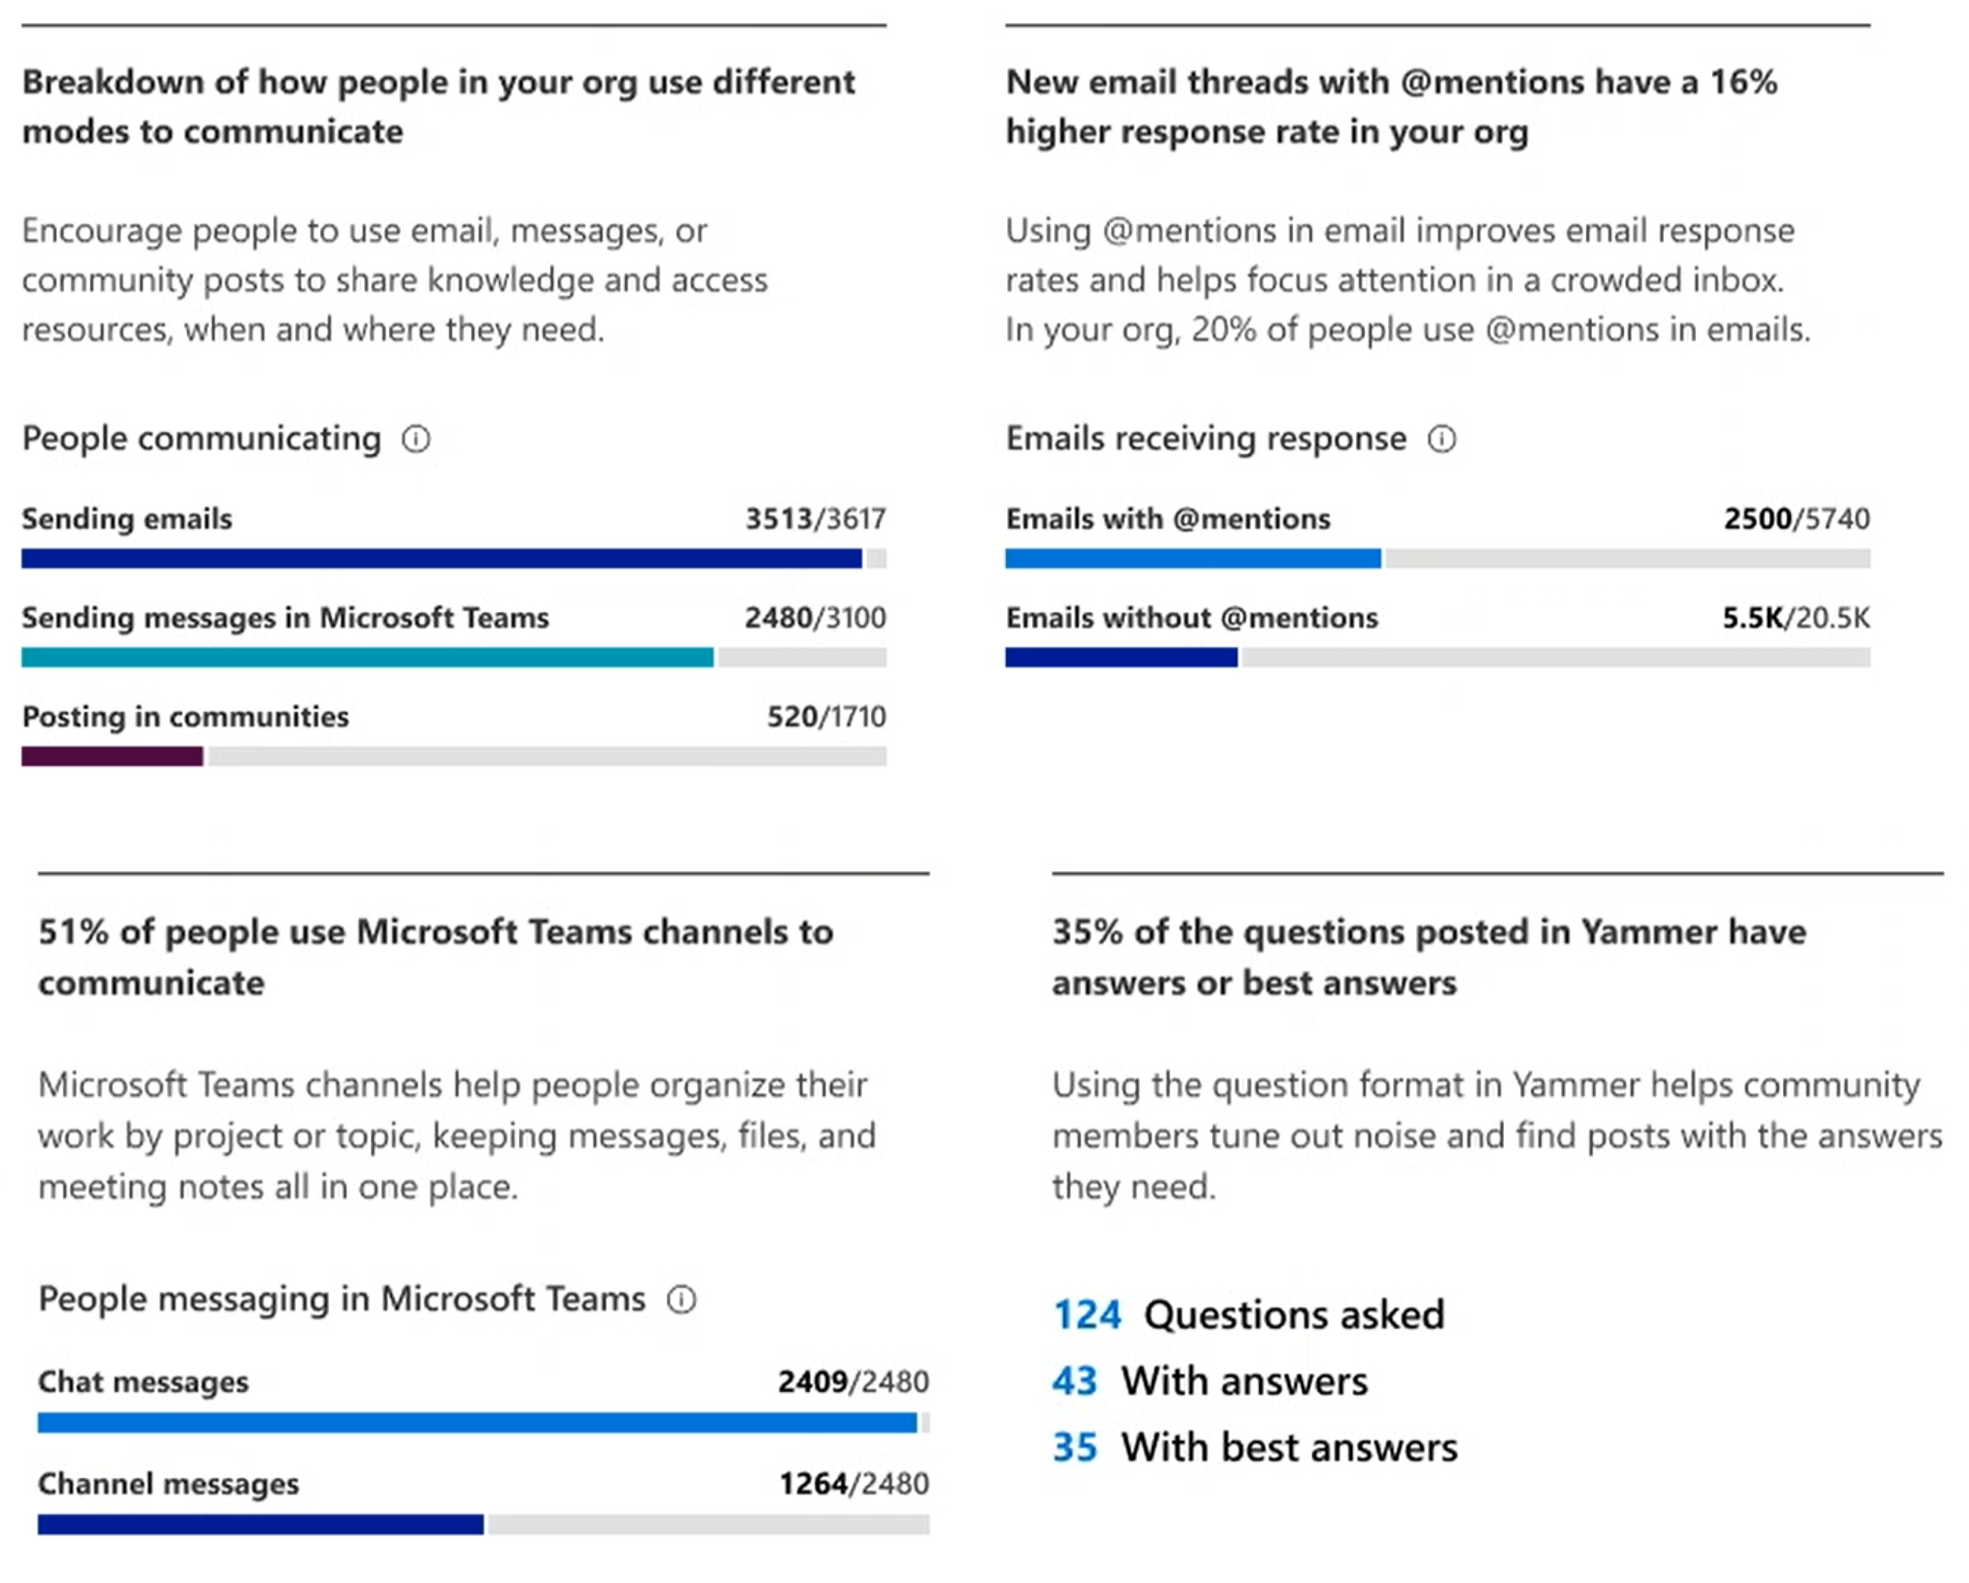
Communication
People have different communication needs. Microsoft 365 enables flexibility in communication modes to fit everyone's needs. Research shows that using real-time communication tools creates a more unified organization and builds morale, regardless of location.
The supporting metrics for the communication category:
Breakdown of communication by modes - The use for each mode, including emails, Teams, and Yammer.
@mentions in emails - The response rate for new email threads based on whether they had @mentions or not.
Breakdown of messages by type in Microsoft Teams - The use of chat and channel messages.
Questions and Answers in Yammer - The use of the questions and answers feature in your organization.

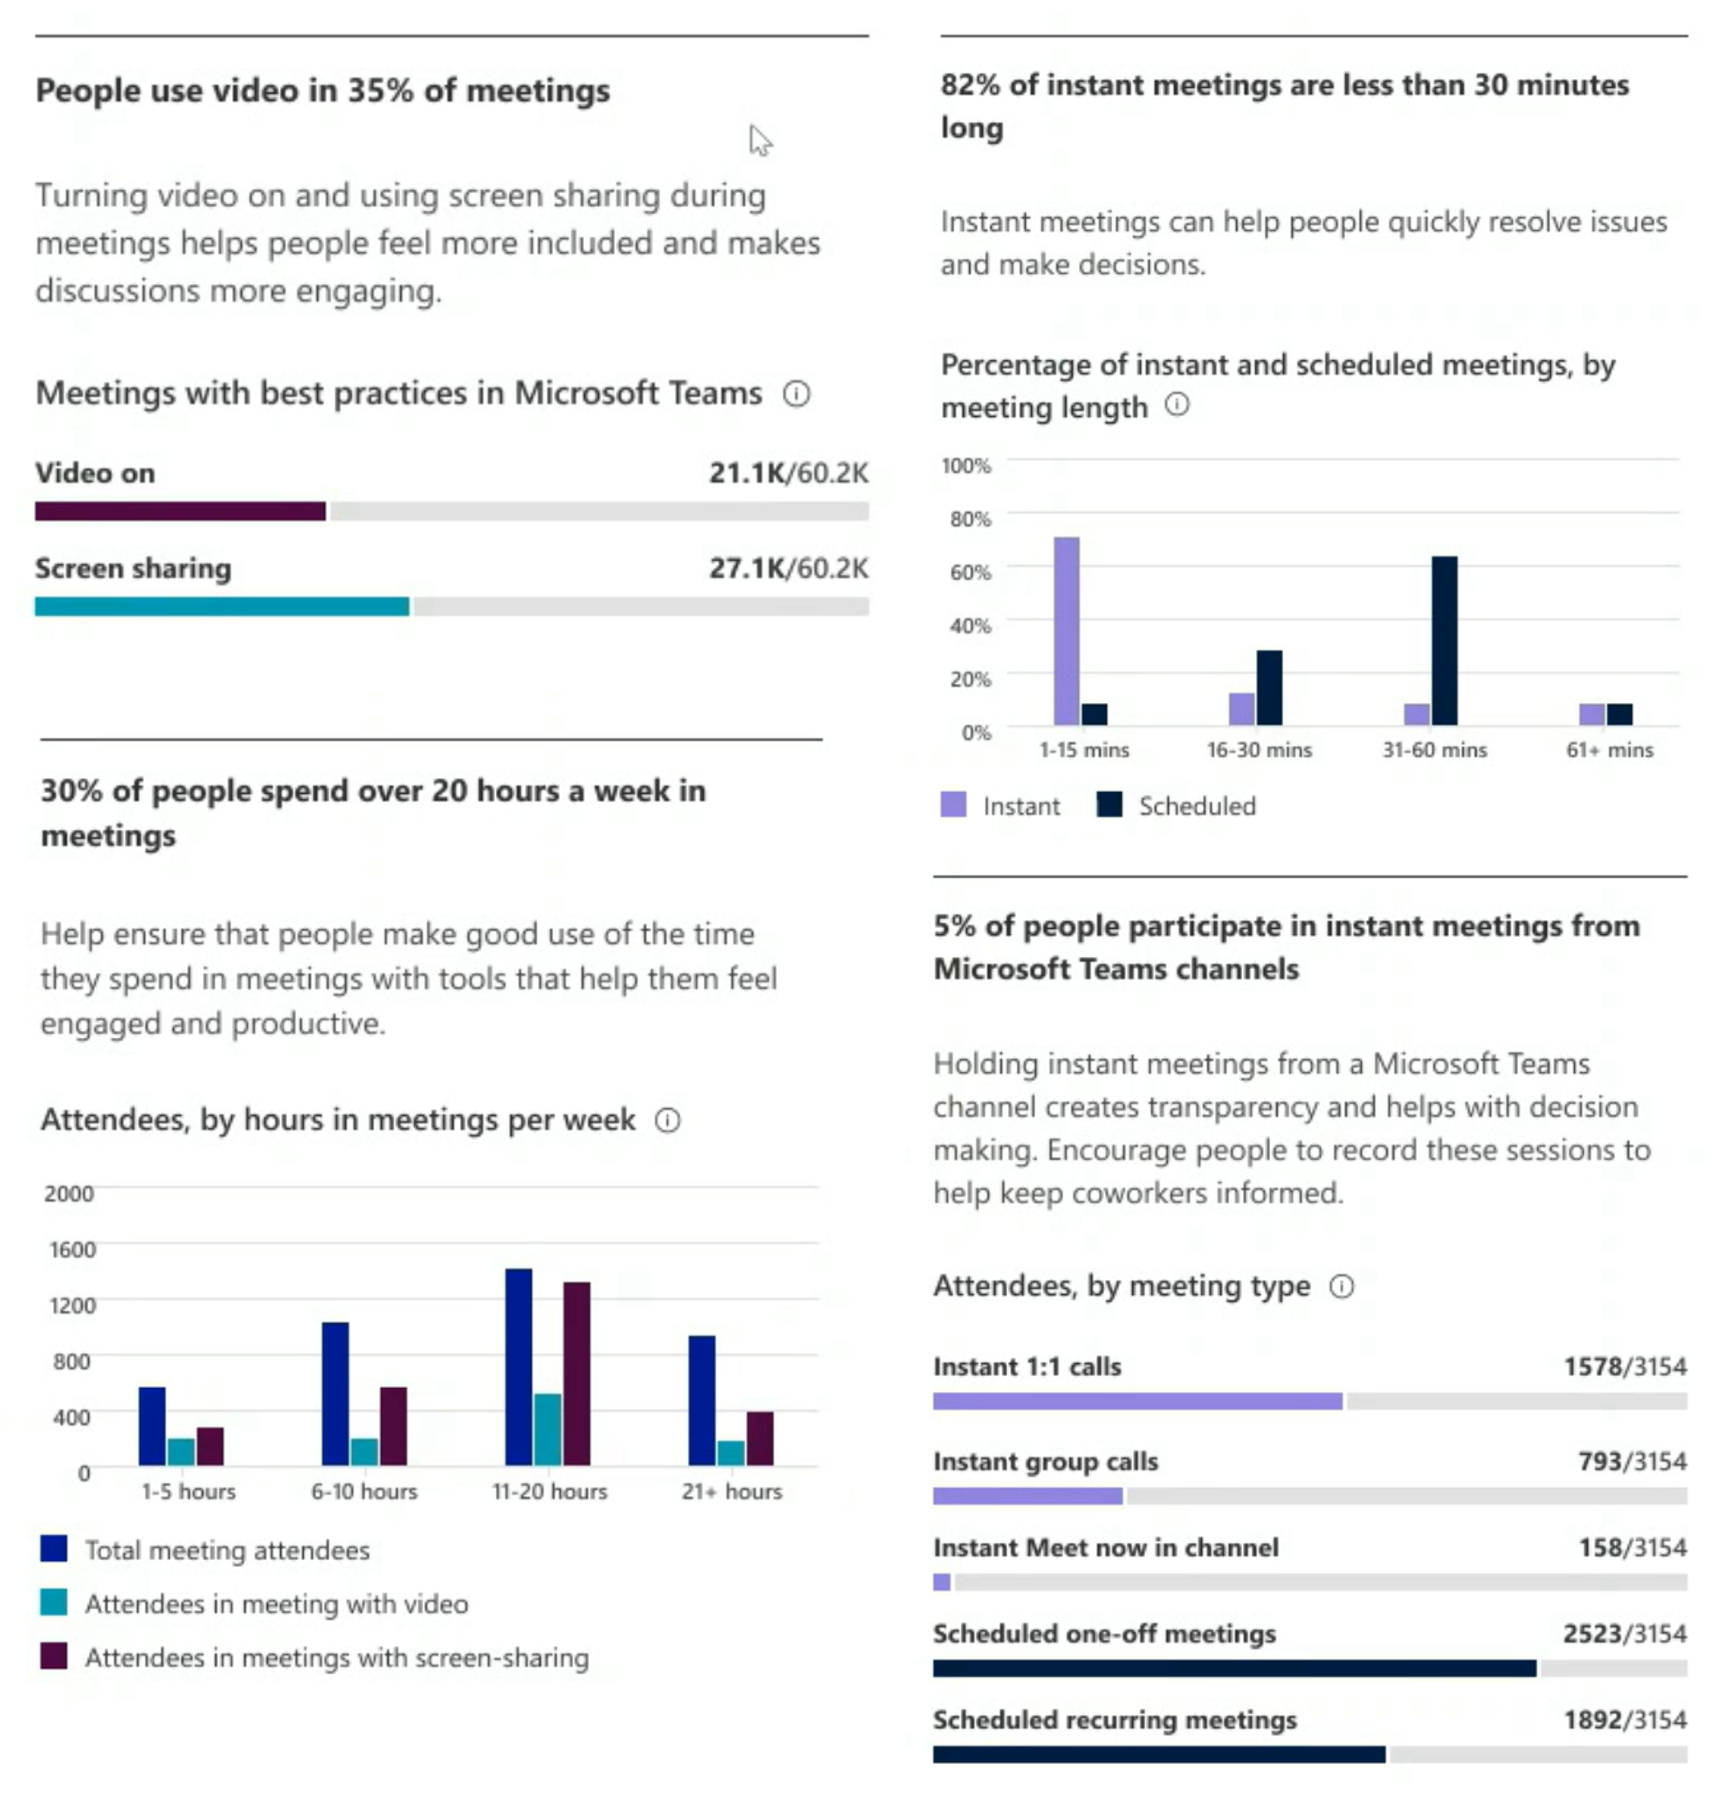
Meetings
Meetings, where people explore ideas, plan, solve problems, and make decisions, are a fundamental pillar for organizational productivity. Research indicates that when people use online meeting tools effectively, they tend to save up to 104 minutes per week.
The supporting metrics for the meetings category:
Breakdown of how many meetings follow best practices - Represent the extent to which online Microsoft Teams meetings are following each of the following best practices.
Distribution of time spent by people in meetings - Provides a view of people in your organization based on their average time spent per week in meetings within the last 28 days.
Distribution of meeting length by type - The distribution of length (in minutes) of instant and scheduled meetings that took place in your organization in the last 28 days.
Use of different meeting types - The types of meetings are being attended by people who are attending any online Microsoft Teams meetings.

Teamwork
A fundamental pillar for organizational productivity is when a group of people with a common goal work with each other and with common resources for collective success. Research indicates that when people share information and collaborate in shared workspaces, they save up to 4 hours a week.
The supporting metrics for the teamwork category:
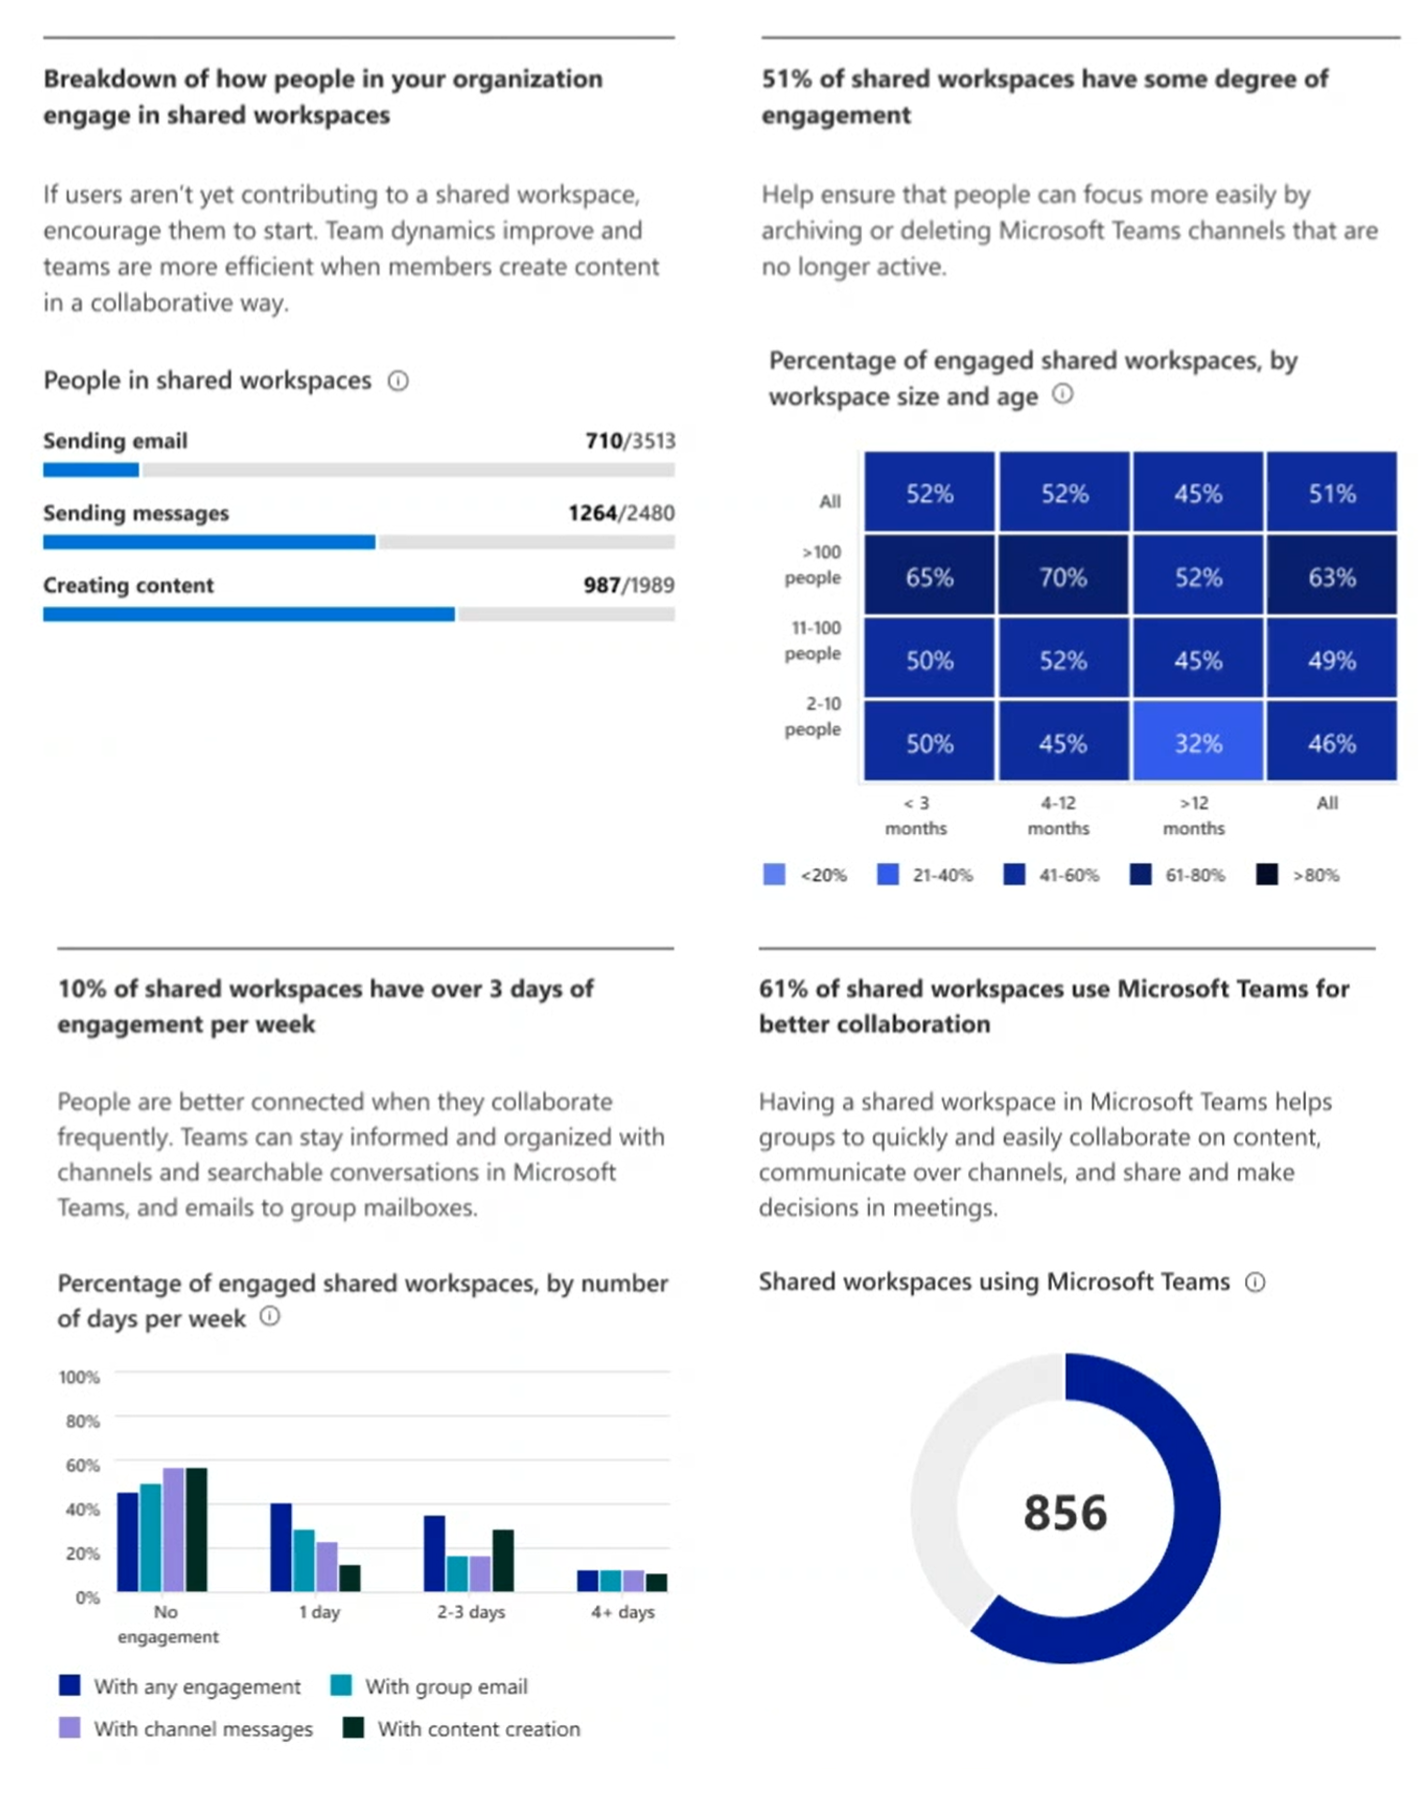
Breakdown of how people engage in shared workspaces - The extent to which people who are communicating or interacting with content are doing so in shared workspaces.
Breakdown of workspace engagement by size and age - The engagement breakdown is shown in the form of a heat-map across two dimensions.
Breakdown of workspaces by level of engagement - Provides a view of the workspaces in your organization based on the intensity of engagement per week, including distributions for different activity types measured within teamwork.
Use of teams within Microsoft Teams - Reflects the percentage of workspaces that have a Microsoft Teams team attached to them.

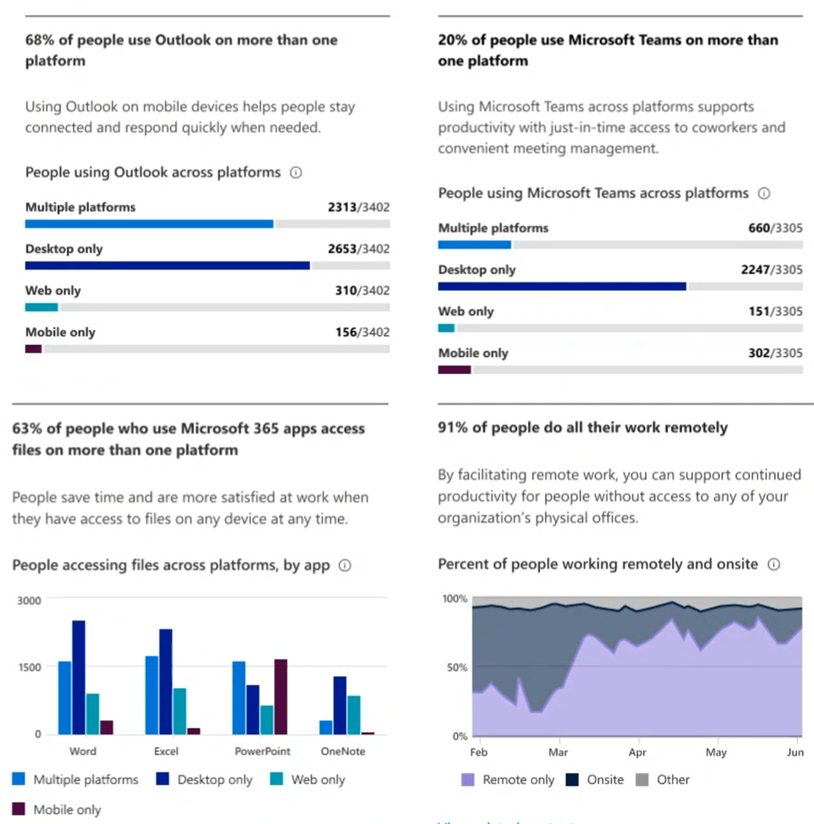
Mobility
A fundamental pillar of organizational productivity is how well people are able to work flexibly from wherever they are. With Microsoft 365, people can stay connected with Outlook, Microsoft Teams, and Yammer. People can also seamlessly collaborate on content by using Word, Excel, PowerPoint, and OneNote from any location, and platforms.
The supporting metrics for the mobility category:
Use of Outlook across platforms - The percentage of people who are active on Outlook and are using either one or more than one platform.
Use of Teams across platforms - The percentage of people active on Microsoft Teams who are using it on either a single platform, or multiple ones.
Use of Microsoft 365 Apps across platforms - Represent the number of people who are using each of the apps considered–Word, Excel, PowerPoint, and OneNote—across single or multiple platforms.
Remote work - Daily percentage of people who only work remotely and daily percentage of people who also work onsite. Users are considered onsite if they perform at least three hours of activity in Microsoft 365 Apps in a day.