Exercise - Combine table results by using the join operator
In this exercise, you learn how to use the join operator. Recall that the join operator merges the rows of two tables by matching values of the specified columns from each table.
Let's use the results of the join operator to answer questions about sales.
Use the join operator
In our retail company scenario, your team is asking you to list the three countries/regions that have the most sales.
As you begin inspecting the SalesFact table, you notice that the figures you need are available in the SalesAmount column, but the table doesn't contain any country/region data. Examining the other tables, you notice that the country/region data is available in the RegionCountryName column in the Customers table. You also notice that both tables have a CustomerKey column.
Because the data is spread over two tables, you need both the customer data and the sales data to write a query that provides the requested information. To write the query, you use the join operator and the CustomerKey column to match the rows from both tables.
Now you're ready to write the query. Use an inner join to get all matching rows from both tables. For best performance, use the customers dimension table as the left table and the sales fact table as the right table.
In the following procedure, you build the query in stages to give yourself a better understanding of the result of using the join operator.
Run the following query to get 10 matching arbitrary rows from the Customers table and the SalesFact table.
Customers
| join kind=inner SalesFact on CustomerKey
| take 10
Take a look at the resulting list. Notice that the table contains columns from the Customers table, followed by matching columns from the SalesFact table.
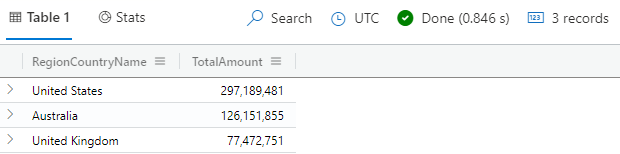
Run the following query to summarize the joined tables to get the three countries/regions that have the most sales.
Customers
| join kind=inner SalesFact on CustomerKey
| summarize TotalAmount = round(sum(SalesAmount)) by RegionCountryName
| top 3 by TotalAmount
Your results should look like those in the following image:
Take a look at the resulting list. Try modifying the query to also show the corresponding total cost and profit for these countries/regions.
Your team then asks you to identify the countries/regions with the lowest revenues in the last recorded year, by month. To get this data, you use a similar query. But this time, you use the startofmonth() function to facilitate grouping by month. You also use the arg_min() aggregation function to find the countries/regions with the lowest revenues in each month.
Run the following query.
Customers
| join kind=inner SalesFact on CustomerKey
| summarize TotalAmount = round(sum(SalesAmount))
    by Month = startofmonth(DateKey), RegionCountryName
| summarize arg_min(TotalAmount, RegionCountryName) by Month
| top 12 by Month desc
Your results should look like those in the following image:
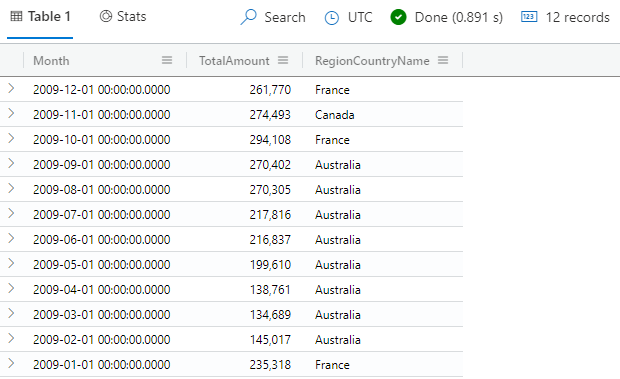
Look at each row. Notice that the first column shows the months of the last year, in descending order, followed by columns that show the total sales for the country/region with the lowest sales numbers that month.
Use the rightouter join kind
Your sales team wants to know the total sales by product category. When you start reviewing the available data, you realize that you need the Products table to get the list of product categories and the SalesFact table to get the sales data. You also realize that you want to count the sales for each category and list all product categories.
Having analyzed the request, you choose to use the rightouter join, because it returns all sales records from the right table, enriched with matching data product category from the left table. You write your query by using the Products table as the left dimension table, matching data from the SalesFact facts table, and grouping the result by product category.
Run the following query.
Products
| join kind=rightouter SalesFact on ProductKey
| summarize TotalSales = count() by ProductCategoryName
| order by TotalSales desc
Your results should look like those in the following image:
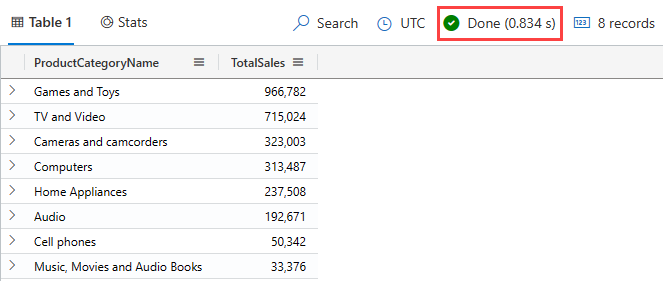
Notice that the execution time is 0.834 seconds, though this time might vary between runs. This query is one way to get this answer and is a good example of a query that isn't optimized for performance. Later, you can compare this time with the execution time of an equivalent query by using the
lookupoperator, which is optimized for this type of data.
Use the rightanti join kind
Similarly, your sales team wants to know the number of products that don't sell in each product category. You can use a rightanti join to get all the rows from the Products table that don't match any rows in the SalesFacts table, and then group the results by product category.
Run the following query.
SalesFact
| join kind=rightanti Products on ProductKey
| summarize Count = count() by ProductCategoryName
| order by Count desc
Your results should look like those in the following image:
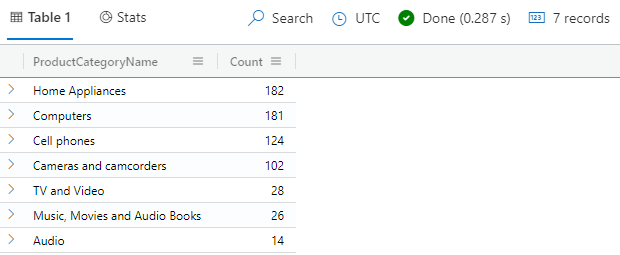
Look at each row. The results show the number of unsold products per product category. Notice that the rightanti
joinselects only products that have no sales facts, indicating that there were no sales for the products returned by thejoinoperator.