Exercise - Work with tables and charts in Excel add-ins
In this exercise, you'll learn how to work with tables and charts using the Office.js Excel JavaScript API. After creating a table, you'll learn how you can apply sorting and filtering actions on the data within the table. You'll also learn how to create and edit charts in the workbook using from your custom Excel add-in.
Prerequisites
Developing Office Add-ins for Microsoft Excel requires Excel 2016, version 1711 (Build 8730.1000 Click-to-Run) or later. You might need to be an Office Insider to get this version. For more information, see Be an Office Insider.
You'll use Node.js to create the custom Excel add-in in this module. The exercises in this module assume you have the following tools installed on your developer workstation.
Important
In most cases, installing the latest version of the following tools is the best option. The versions listed here were used when this module was published and last tested.
- Node.js - (the active LTS version)
- npm (installed with Node.js)
- Yeoman - v4.x (or higher)
- Yeoman Generator for Microsoft Office - v1.9.5
- Visual Studio Code
Create your add-in project
Run the following command to create an add-in project using the Yeoman generator:
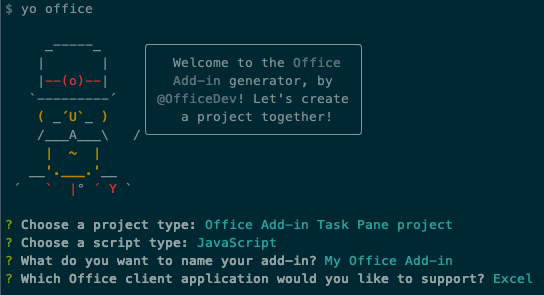
yo office
Note
When you run the yo office command, you may receive prompts about the data collection policies of Yeoman and the Office Add-in CLI tools. Use the information that's provided to respond to the prompts as you see fit.
When prompted, provide the following information to create your add-in project:
- Choose a project type: Office Add-in Task Pane project
- Choose a script type: JavaScript
- What do you want to name your add-in? My Office Add-in
- Which Office client application would you like to support? Excel
After you complete the wizard, change to the project folder created by the generator (My Office Add-in) and install the npm modules by running npm install.
Tip
You can ignore any warnings or errors when installing dependencies and the Congratulations! Your add-in has been created! Your next steps: guidance the Yeoman generator displays. The remainder of this unit include all the steps you'll need to follow.
Create a table
In this section, you'll programmatically test that your add-in supports the user's current version of Excel, add a table to a worksheet, populate the table with data, and format it.
Code the add-in
Open the project in your code editor.
Open the file ./src/taskpane/taskpane.html. This file contains the HTML markup for the task pane.
Locate the
<main>element and delete all lines that appear after the opening<main>tag and before the closing</main>tag.Add the following markup immediately after the opening
<main>tag:<button class="ms-Button" id="create-table">Create Table</button><br/><br/>Open the file ./src/taskpane/taskpane.js. This file contains the Office JavaScript API code that makes interaction between the task pane and the Office host application.
Remove all references to the run button and the
run()function by doing the following:- Locate and delete the line
document.getElementById("run").onclick = run;. - Locate and delete the entire
run()function.
- Locate and delete the line
Within the
Office.onReady()method call, locate the lineif (info.host === Office.HostType.Excel) {and add the following code immediately after that line:// Determine if the user's version of Office supports all the Office.js APIs that are used in the tutorial. if (!Office.context.requirements.isSetSupported('ExcelApi', '1.7')) { console.log('Sorry. The tutorial add-in uses Excel.js APIs that are not available in your version of Office.'); } // Assign event handlers and other initialization logic. document.getElementById("create-table").onclick = createTable;Note
- The first part of this code determines whether the user's version of Excel supports a version of Excel.js that includes all the APIs that this series of tutorials will use. In a production add-in, use the body of the conditional block to hide or disable the UI that would call unsupported APIs. This will enable the user to still make use of the parts of the add-in that are supported by their version of Excel.
- The second part of this code adds an event handler for the create-table button.
Add the following function to the end of the file:
async function createTable() {
  await Excel.run(async (context) => {

    // TODO1: Queue table creation logic here.

    // TODO2: Queue commands to populate the table with data.

    // TODO3: Queue commands to format the table.

    await context.sync();
  })
  .catch(function (error) {
    console.log("Error: " + error);
    if (error instanceof OfficeExtension.Error) {
      console.log("Debug info: " + JSON.stringify(error.debugInfo));
    }
  });
}
Note
- Your Excel.js business logic will be added to the function that is passed to
Excel.run(). This logic doesn't execute immediately. Instead, it's added to a queue of pending commands. - The
context.sync()method sends all queued commands to Excel for execution. - The
Excel.run()is followed by acatchblock. This is a best practice that you should always follow.
- Your Excel.js business logic will be added to the function that is passed to
Within the
createTable()function, replaceTODO1with the following code:const currentWorksheet = context.workbook.worksheets.getActiveWorksheet(); const expensesTable = currentWorksheet.tables.add("A1:D1", true /*hasHeaders*/); expensesTable.name = "ExpensesTable";Note
- The code creates a table by using
add()method of a worksheet's table collection, which always exists even if it's empty. This is the standard way that Excel.js objects are created. There are no class constructor APIs, and you never use anewoperator to create an Excel object. Instead, you add to a parent collection object. - The first parameter of the
add()method is the range of only the top row of the table, not the entire range the table will ultimately use. This is because when the add-in populates the data rows (in the next step), it will add new rows to the table instead of writing values to the cells of existing rows. This is a more common pattern because the number of rows that a table will have is often not known when the table is created. - Table names must be unique across the entire workbook, not just the worksheet.
- The code creates a table by using
Within the
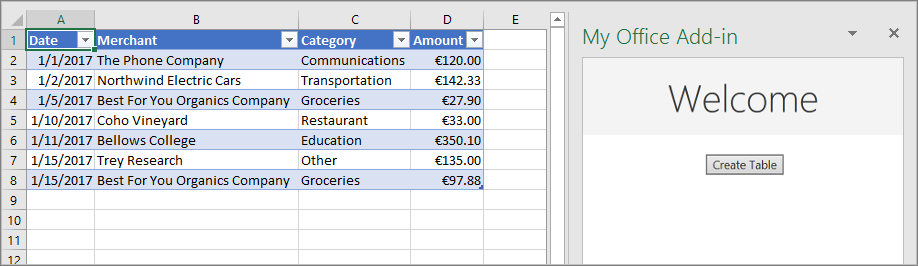
createTable()function, replaceTODO2with the following code:expensesTable.getHeaderRowRange().values = [["Date", "Merchant", "Category", "Amount"]]; expensesTable.rows.add(null /*add at the end*/, [ ["1/1/2017", "The Phone Company", "Communications", "120"], ["1/2/2017", "Northwind Electric Cars", "Transportation", "142.33"], ["1/5/2017", "Best For You Organics Company", "Groceries", "27.9"], ["1/10/2017", "Coho Vineyard", "Restaurant", "33"], ["1/11/2017", "Bellows College", "Education", "350.1"], ["1/15/2017", "Trey Research", "Other", "135"], ["1/15/2017", "Best For You Organics Company", "Groceries", "97.88"] ]);Note
- The cell values of a range are set with an array of arrays.
- New rows are created in a table by calling the
add()method of the table's row collection. You can add multiple rows in a single call ofadd()by including multiple cell value arrays in the parent array that is passed as the second parameter.
Within the
createTable()function, replaceTODO3with the following code:expensesTable.columns.getItemAt(3).getRange().numberFormat = [['\u20AC#,##0.00']]; expensesTable.getRange().format.autofitColumns(); expensesTable.getRange().format.autofitRows();Note
- The code gets a reference to the Amount column by passing its zero-based index to the
getItemAt()method of the table's column collection. - Excel.js collection objects, such as
TableCollection,WorksheetCollection, andTableColumnCollectionhave anitemsproperty that is an array of the child object types, such asTableorWorksheetorTableColumn; but a*Collectionobject isn't itself an array. - The code then formats the range of the Amount column as Euros to the second decimal.
- Finally, it ensures that the width of the columns and height of the rows is large enough to fit the longest (or tallest) data item. Notice that the code must get
Rangeobjects to format.TableColumnandTableRowobjects don't have format properties.
- The code gets a reference to the Amount column by passing its zero-based index to the
Verify that you've saved all of the changes you've made to the project.
Test the add-in
Complete the following steps to start the local web server and sideload your add-in.
Note
Office Add-ins should use HTTPS, not HTTP, even when you are developing. If you are prompted to install a certificate after you run one of the following commands, accept the prompt to install the certificate that the Yeoman generator provides.
Tip
If you're testing your add-in on macOS, run the following command in the root directory of your project before proceeding. When you run this command, the local web server starts.
npm run dev-serverTo test your add-in in Excel, run the following command in the root directory of your project. This starts the local web server (if it's not already running) and opens Excel with your add-in loaded.
npm startTo test your add-in in Excel on the web, run the following command in the root directory of your project. When you run this command, the local web server will start (if it's not already running).
npm run start:webTo use your add-in, open a new document in Excel on the web and then sideload your add-in by following the instructions in Sideload Office Add-ins in Office on the web.
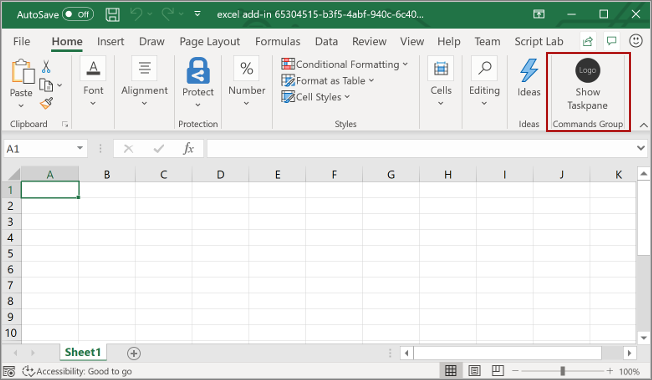
In Excel, select the Home tab, and then select the Show Taskpane button in the ribbon to open the add-in task pane.
In the task pane, select the Create Table button.
Filter and sort a table
In this section, you'll filter and sort the table that you created previously.
Filter the table
Open the file ./src/taskpane/taskpane.html.
Locate the
<button>element for the create-table button, and add the following markup after that line:<button class="ms-Button" id="filter-table">Filter Table</button><br/><br/>Open the file ./src/taskpane/taskpane.js.
Within the
Office.onReady()method call, locate the following line in theOffice.onRead()method:document.getElementById("create-table").onclick = createTable;Add the following code immediately after it:
document.getElementById("filter-table").onclick = filterTable;Add the following function to the end of the file:
async function filterTable() {
  await Excel.run(async (context) => {

    // TODO1: Queue commands to filter out all expense categories except
    //        Groceries and Education.

    await context.sync();
  })
  .catch(function (error) {
    console.log("Error: " + error);
    if (error instanceof OfficeExtension.Error) {
      console.log("Debug info: " + JSON.stringify(error.debugInfo));
    }
  });
}
Within the
filterTable()function, replaceTODO1with the following code:const currentWorksheet = context.workbook.worksheets.getActiveWorksheet(); const expensesTable = currentWorksheet.tables.getItem('ExpensesTable'); const categoryFilter = expensesTable.columns.getItem('Category').filter; categoryFilter.applyValuesFilter(['Education', 'Groceries']);Note
- The code first gets a reference to the column that needs filtering by passing the column name to the
getItem()method, instead of passing its index to thegetItemAt()method as thecreateTable()method does. Since users can move table columns, the column at a given index might change after the table is created. It's safer to use the column name to get a reference to the column. We usedgetItemAtsafely in the preceding tutorial, because we used it in the same method that creates the table, so there's no chance that a user has moved the column. - The
applyValuesFilter()method is one of several filtering methods on theFilterobject.
- The code first gets a reference to the column that needs filtering by passing the column name to the
Sort the table
Open the file ./src/taskpane/taskpane.html.
Locate the
<button>element for the filter-table button, and add the following markup after that line:<button class="ms-Button" id="sort-table">Sort Table</button><br/><br/>Open the file ./src/taskpane/taskpane.js.
Within the
Office.onReady()method call, locate the following line in theOffice.onRead()method:document.getElementById("filter-table").onclick = filterTable;Add the following code immediately after it:
document.getElementById("sort-table").onclick = sortTable;Add the following function to the end of the file:
async function sortTable() {
  await Excel.run(async (context) => {

    // TODO1: Queue commands to sort the table by Merchant name.

    await context.sync();
  })
  .catch(function (error) {
    console.log("Error: " + error);
    if (error instanceof OfficeExtension.Error) {
      console.log("Debug info: " + JSON.stringify(error.debugInfo));
    }
  });
}
Within the
sortTable()function, replaceTODO1with the following code:const currentWorksheet = context.workbook.worksheets.getActiveWorksheet(); const expensesTable = currentWorksheet.tables.getItem('ExpensesTable'); const sortFields = [ { key: 1, // Merchant column ascending: false, } ]; expensesTable.sort.apply(sortFields);Note
- The code creates an array of
SortFieldobjects, which has just one member since the add-in only sorts on the Merchant column. - The
keyproperty of aSortFieldobject is the zero-based index of the column to sort-on. - The
sortmember of aTableis aTableSortobject, not a method. TheSortFields are passed to theTableSortobject'sapply()method.
- The code creates an array of
Verify that you've saved all of the changes you've made to the project.
Test the add-in
If the local web server is already running and your add-in is already loaded in Excel, continue to step 2. Otherwise, start the local web server and sideload your add-in:
To test your add-in in Excel, run the following command in the root directory of your project. This starts the local web server (if it's not already running) and opens Excel with your add-in loaded.
npm startTo test your add-in in Excel on the web, run the following command in the root directory of your project. When you run this command, the local web server will start (if it's not already running).
npm run start:webTo use your add-in, open a new document in Excel on the web and then sideload your add-in by following the instructions in Sideload Office Add-ins in Office on the web.
If the add-in task pane isn't already open in Excel, go to the Home tab, and select the Show Taskpane button in the ribbon to open it.
If the table you added previously in this tutorial isn't present in the open worksheet, select the Create Table button in the task pane.
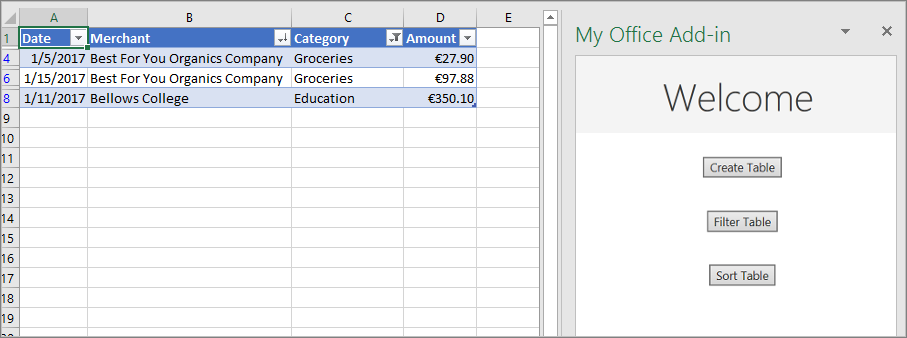
Select the Filter Table button and the Sort Table button, in either order.
Create a chart
In this section, you'll create a chart using data from the table that you created previously, and then format the chart.
Chart a chart using table data
Open the file ./src/taskpane/taskpane.html.
Locate the
<button>element for the sort-table button, and add the following markup after that line:<button class="ms-Button" id="create-chart">Create Chart</button><br/><br/>Open the file ./src/taskpane/taskpane.js.
Within the
Office.onReady()method call, locate the following line in theOffice.onRead()method:document.getElementById("sort-table").onclick = sortTable;Add the following code immediately after it:
document.getElementById("create-chart").onclick = createChart;Add the following function to the end of the file:
async function createChart() {
  await Excel.run(async (context) => {

    // TODO1: Queue commands to get the range of data to be charted.

    // TODO2: Queue command to create the chart and define its type.

    // TODO3: Queue commands to position and format the chart.

    await context.sync();
  })
  .catch(function (error) {
    console.log("Error: " + error);
    if (error instanceof OfficeExtension.Error) {
      console.log("Debug info: " + JSON.stringify(error.debugInfo));
    }
  });
}
Within the
createChart()function, replaceTODO1with the following code. To exclude the header row, the code uses theTable.getDataBodyRange()method to get the range of data you want to chart instead of thegetRange()method.const currentWorksheet = context.workbook.worksheets.getActiveWorksheet(); const expensesTable = currentWorksheet.tables.getItem('ExpensesTable'); const dataRange = expensesTable.getDataBodyRange();Within the
createChart()function, replaceTODO2with the following code:const chart = currentWorksheet.charts.add('ColumnClustered', dataRange, 'auto');Note
- The first parameter to the
add()method specifies the type of chart. There are several dozen types. - The second parameter specifies the range of data to include in the chart.
- The third parameter determines whether a series of data points from the table should be charted row-wise or column-wise. The option
autotells Excel to decide the best method.
- The first parameter to the
Within the
createChart()function, replaceTODO3with the following code. Most of this code is self-explanatory:chart.setPosition("A15", "F30"); chart.title.text = "Expenses"; chart.legend.position = "right" chart.legend.format.fill.setSolidColor("white"); chart.dataLabels.format.font.size = 15; chart.dataLabels.format.font.color = "black"; chart.series.getItemAt(0).name = 'Value in €';Note
- The parameters to the
setPosition()method specify the upper left and lower right cells of the worksheet area that should contain the chart. Excel can adjust things like line width to make the chart look good in the space it has been given. - A "series" is a set of data points from a column of the table. Since there's only one non-string column in the table, Excel infers that the column is the only column of data points to chart. It interprets the other columns as chart labels. So there will be just one series in the chart and it will have index 0. This is the one to label with "Value in €".
- The parameters to the
Verify that you've saved all of the changes you've made to the project.
Test the add-in
If the local web server is already running and your add-in is already loaded in Excel, continue to step 2. Otherwise, start the local web server and sideload your add-in:
To test your add-in in Excel, run the following command in the root directory of your project. This starts the local web server (if it's not already running) and opens Excel with your add-in loaded.
npm startTo test your add-in in Excel on the web, run the following command in the root directory of your project. When you run this command, the local web server will start (if it's not already running).
npm run start:webTo use your add-in, open a new document in Excel on the web and then sideload your add-in by following the instructions in Sideload Office Add-ins in Office on the web.
If the add-in task pane isn't already open in Excel, go to the Home tab, and select the Show Taskpane button in the ribbon to open it.
If the table you added previously in this tutorial isn't present in the open worksheet, select the Create Table button, and then the Filter Table button and the Sort Table button, in either order.
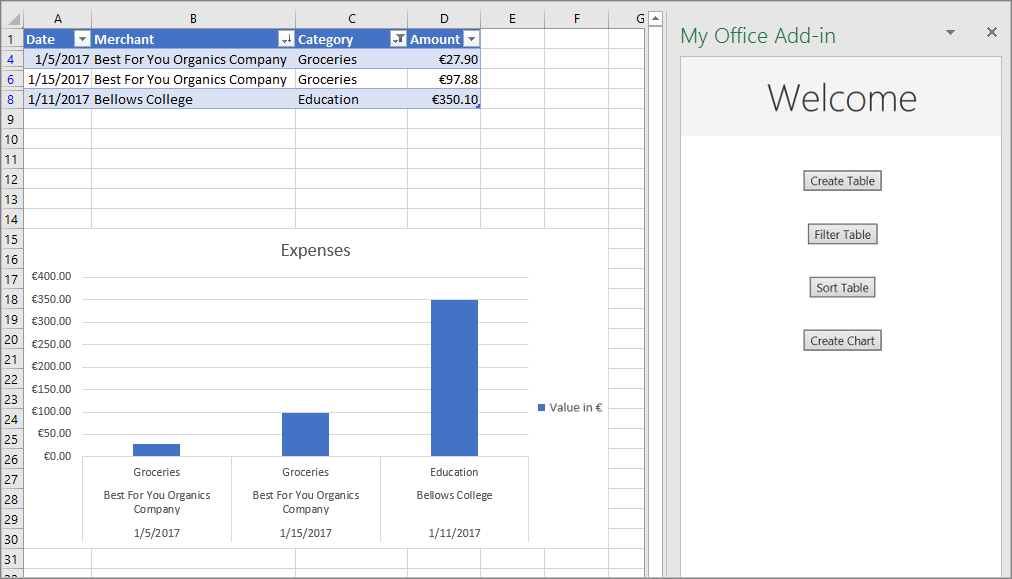
Select the Create Chart button. A chart is created and only the data from the rows that have been filtered are included. The labels on the data points across the bottom are in the sort order of the chart; that is, merchant names in reverse alphabetical order.
Summary
In this exercise, you learned how to work with tables and charts using the Office.js Excel JavaScript API. After creating a table, you learned how you can apply sorting and filtering actions on the data within the table. You also learned how to create and edit charts in the workbook using from your custom Excel add-in.