Learn the importance of field properties
By the end of this unit, you'll be able to understand how field properties are at the core of organizing and simplifying your calculations in Microsoft Power BI.
Here are some of the main field properties that every analyst should include in their Microsoft Power BI workbooks:
- Add a field description
- Create folders
- Change data types
- Change format
- Set Sort by column
- Set Summary by
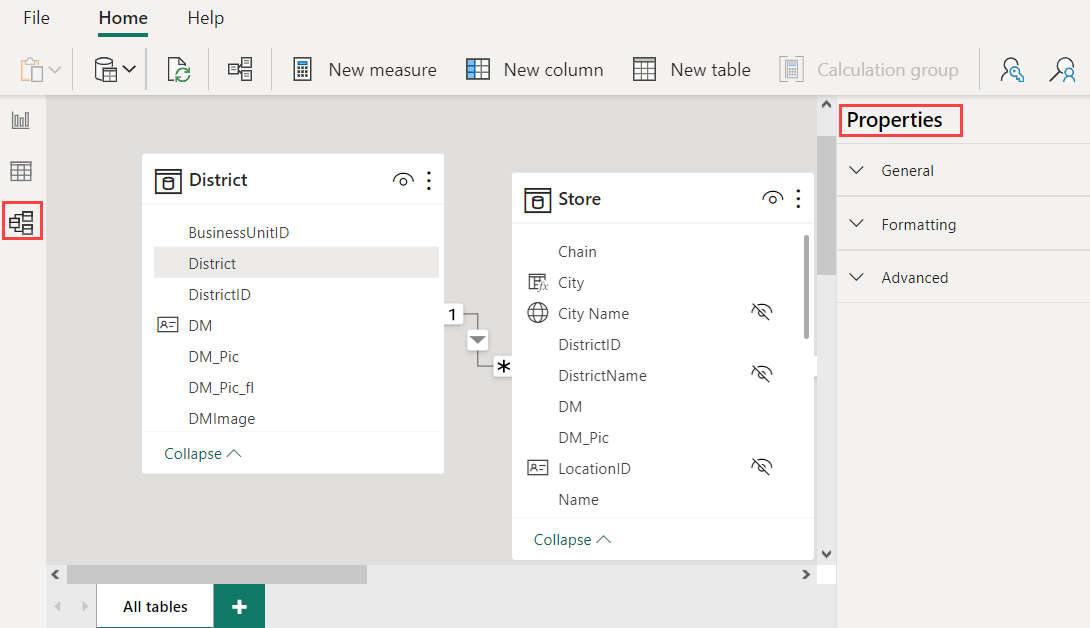
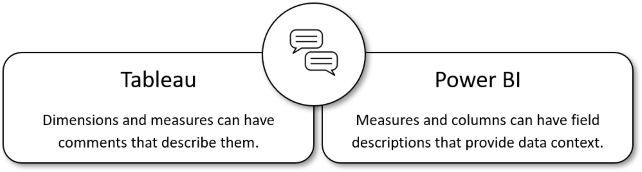
Understand your fields with field descriptions
Adding a field description allows users to type in whatever business description fits best. When an end user hovers over the field, the text is displayed. If you have multiple users editing your reports, this is a great way for everyone to understand what fields they should use and how measures and calculated columns are calculated.
Organize your data with a folder
Creating folders within tables can extend the organization of your data. Folders allow you to make logical groupings of fields and measures into a single location. It's a simple task that saves you time and is helpful in the maintenance of your Power BI model.

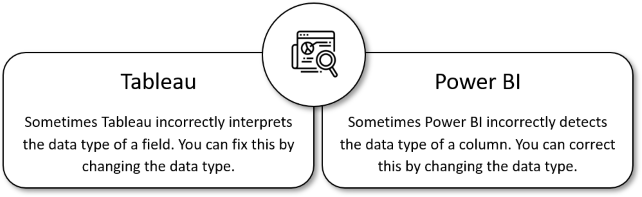
Correct your data by changing its data type
In many cases, Power BI and DAX implicitly convert a data type for you, but there are some cases where it doesn't.
For example, if a DAX function requires a Date data type but the data type of your column is Text, the function doesn't work properly. It's important and useful to get the correct data type for a column.
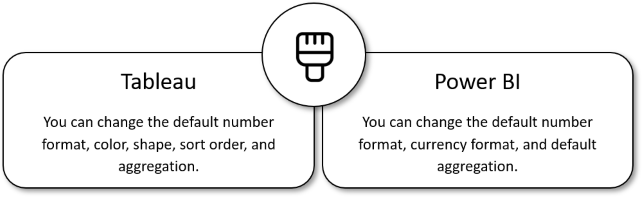
Change your data format
Like changing data types, there are a few locations where we can change the formatting and then set it as the default. This functionality is a time saver in Power BI Desktop. It allows you to change the format once and only adjust later if it deviates from the standard.
For example, you just created a list of percentage measures and every time you visualize the data, you realize the values are displaying as a decimal instead of a percentage. By changing the format, you can make sure that the list of measures displays percentages as their default.
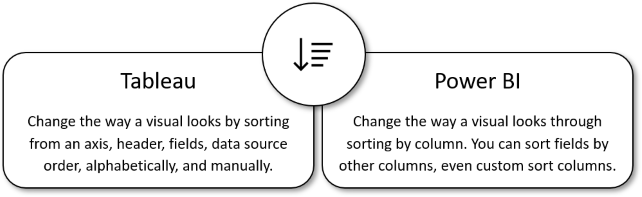
Sort by column to highlight information your way
In Microsoft Power BI Desktop, you can change the appearance of a visualization not only through the visualizations pane but also through sorting by different data fields. By changing how you sort a visual, you can highlight the information you want to portray. By default, when using a field, it sorts A to Z, but that doesn't always make the most sense. With Power BI Desktop, you can set the default sort orders to be based on numeric data (such as sales figures) or text data (such as state names).
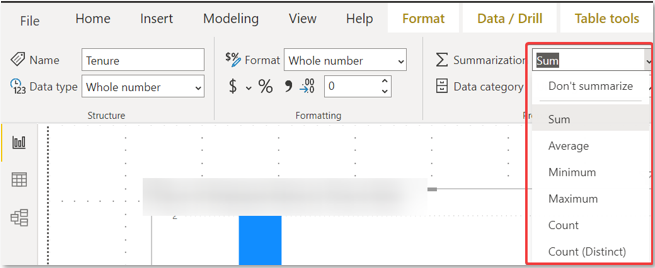
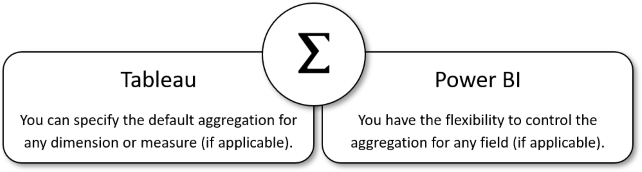
Summarize by other fields to control your fields
In Microsoft Power BI, you have the flexibility to control whether a field should or shouldn't be aggregated. If you decide to aggregate the field, you can set the aggregation type.
See also
For more information on Power BI datatypes, see Data types in Power BI Desktop.
For more information on sorting by columns in Power BI, see Sort by column in Power BI Desktop.