Organize and simplify calculations
Analysts and developers all have their own processes they like to follow when creating and managing datasets in Microsoft Power BI Desktop. However, as the development process continues, it's easy to lose track of that ideal field you had at the beginning, or how you went about naming different things. Some of the new content starts to not make much sense.
This unit explores different techniques to alleviate this issue while also preparing your data for consumption in a way that makes sense to a business user.
Manage your measures with a measures table
Expanding on the idea of grouping similar objects together, the creation of a measures table is often used as a best practice to manage all the measures you create on top of your data. Unlike folders, this is accomplished by creating an empty table.
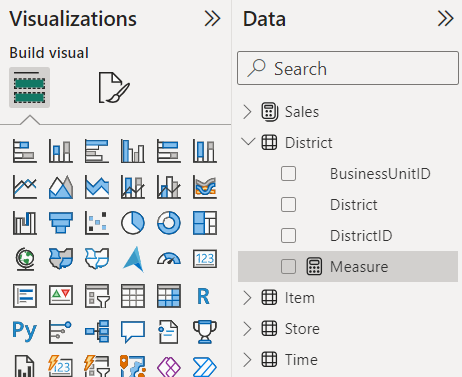
This function is a nice way to group calculations and have the measures table as the first table available at the top in the Data pane.
Note
You can use a separate table because measures are not tied to specific tables.
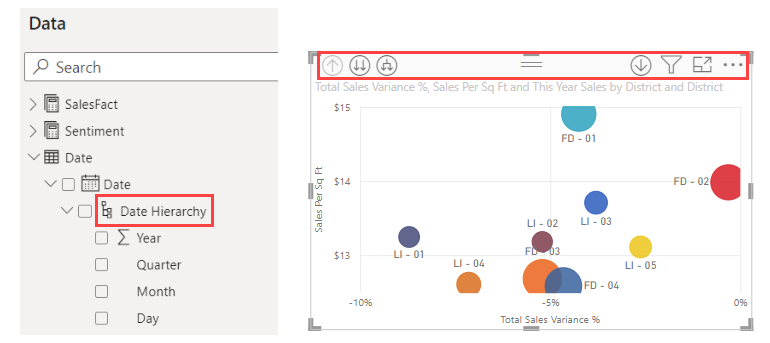
Apply hierarchies
Hierarchies allow for more drill-in functionality and allow for different types of drill-ins. With Microsoft Power BI hierarchies, you can jump levels, use drilling as a filter across all your visuals, and even expand down one level.
Note
With Tableau hierarchies, you must do the full tree effect. When you traverse through the hierarchy, you must do the full drill-down where you always keep the parent-child hierarchy.
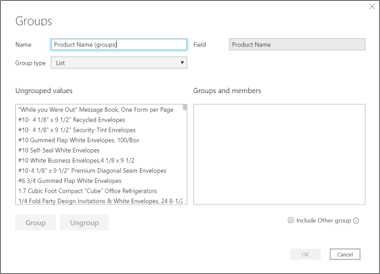
Cluster your data points with groups
Groups allow analysts to group data points to help you view, analyze, and explore data. You can also aggregate data into groups based on values found in the underlying data.
For example, you have a list of store departments and you need to categorize the departments by their performance (high, standard, low). With groups, you can put the departments into their performance category, or group, based on their profit margins.
Create bins
A bin is a type of group that functions similarly, except you define the bin size to put values into equally sized groups.
Note
You can set the bin size for numerical and time fields only. Also, you can make bins for calculated columns, not measures.
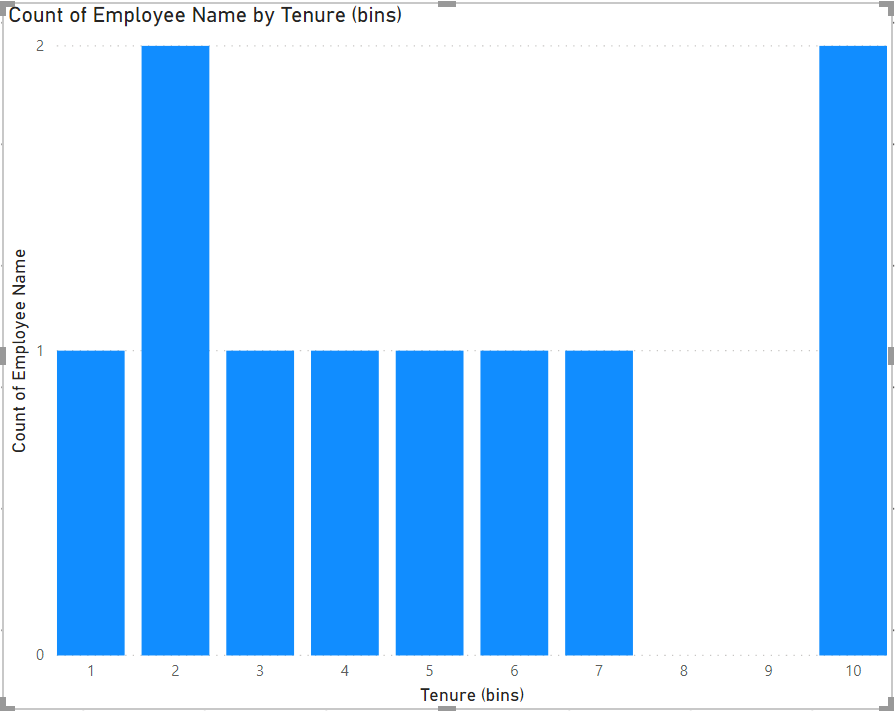
For example, you have an employee list for your company. This list has items like employee name, department, manager, and their tenure. Your task is to find the number of employees that have been with the company for one to 10 years. The bin size is 1, which represents one full year and there are 10 bins.
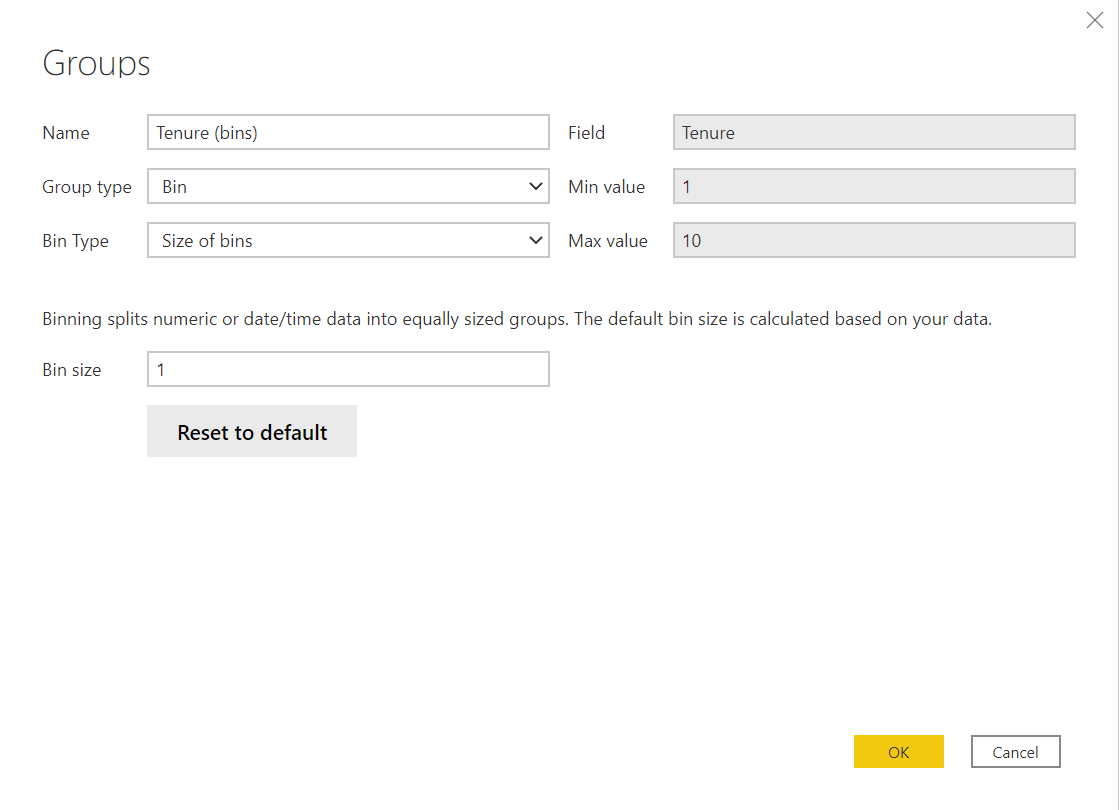
With the new tenure bin field, you can create the following visualization:
Use DAX Studio
The last feature in this unit is DAX Studio, which is a third-party tool that has full integration with Microsoft Power BI.
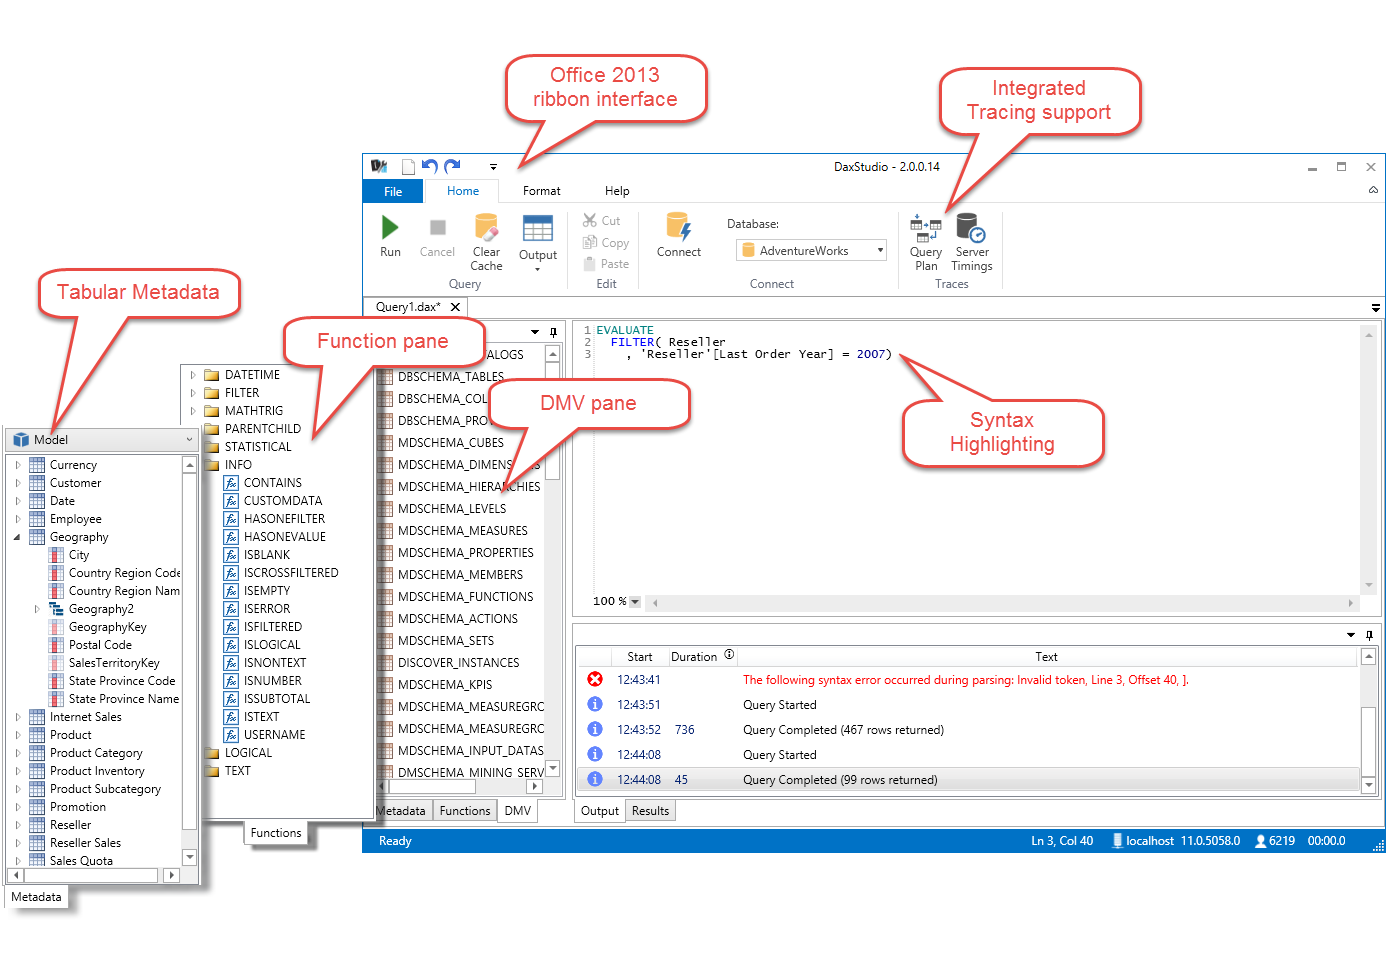
DAX Studio provides a way to execute and analyze DAX queries against Microsoft tabular models. It also provides visibility into the metadata in your model by offering an extract list of your created measures, allows you to see all the tables that are a part of your model, and provides visibility into table functions. When you create table functions in Microsoft Power BI, you don't have full insight on what the structure looks like in that temporary table. DAX Studio allows you to get the full view of that temporary table, which can improve your calculation.
Note
Tableau does not have a metadata tool like DAX Studio.
See also
To learn more about DAX Studio, see DAX Studio.