Format a visualization
There are two ways to adjust formatting: holistically or by visual. You can change the standard formatting for all the visuals you include by adjusting your theme. To adjust all visuals, pick a standard theme and make your preferred changes. This process resembles working with themes in PowerPoint or Word.
You can even ingest a custom JSON theme. This option might sound intimidating if you haven't coded in JSON. There are tools out there that make this process easy by giving you a template to fill out, or they allow you to make selections and then providing the relevant code.
Unless you're setting a theme, all other options fall under one section in Power BI. If you need to change the formatting on a visual, there's only one place to go.
This situation is a nice departure from other tools where formatting is spread over multiple panes and in different areas of the product. There are a wide variety of formatting options, some dependent on the type of visual you choose.
For example, a scatter plot has more options around visual shapes, sizes, and colors than a bar chart because you're encoding more fields in a scatter plot.
Tip
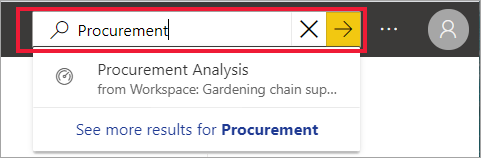
If you ever run into the issue of having too many options, use the Search bar.
Power BI also offers conditional formatting and Tooltips, Learn about these features in the upcoming units.
More information on importing custom report theme files is available.