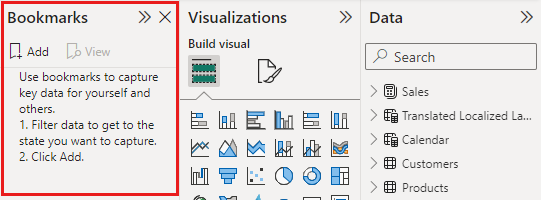
Create a bookmark
Bookmarks are a great way to build navigation or give your end users more options around their experience. It's like Tableau actions and a concept called parameterizing sheets. At its core, is the ability to give end users the option to go between two specific states in your report. It's most often used to swap out visuals in a report.

For example, you have a bar chart in your report that shows your sales by categories. You decide that you now want to see the values as parts of a whole instead of comparing them. You can swap the visual for a tree map. Or, taking it one step further, you swap it out for a table with more detail. This approach is a great option for the end users that are asking to see the numbers in a table. With bookmarks, you're giving options.