Exercise - Add advanced client-side functionality
This hands-on lab shows you how to add JavaScript code to a page to render data from Microsoft Dataverse as a chart by using an external charting library with the data that's retrieved from Dataverse by using portals Web API.
The exercises work best when you have sample data to work with. Depending on the environment that you're working with, you might want to install some sample data to assist with the exercises. Microsoft Power Platform provides you with the ability to add sample data as needed. If the environment that you're working in doesn't have sample data installed, follow the steps in the Add or remove sample data documentation to install the sample data into your environment.
Learning objectives
These exercises help you learn how to:
Set up site settings and table permissions to enable portals Web API requests.
Add inline code to a content webpage to retrieve and transform the data by using the portals Web API.
Use an external JavaScript library to plot the transformed data.
Prerequisites
For this exercise, make sure that your environment has the following parameters set up:
A provisioned Power Pages website. If you don't have a Power Pages website available, follow the instructions in the Create a site with Power Pages documentation to create one.
Access to the Power Pages maker home page.
High-level steps
To finish the exercise, complete the following tasks:
Create site settings and table permissions that allow portals Web API read requests to the accounts table.
Create a content page and add JavaScript code that retrieves and transforms the data.
Add a charting library to the page and JavaScript code by using the library to build a graph with the retrieved data.
Detailed steps
Follow the detailed steps to complete this lab.
Enable portals Web API requests
This section shows you how to enable portals Web API requests to the accounts table.
Create site settings
To create site settings, follow these steps.
Sign in to Power Pages home.
Select the correct environment in the upper-right corner.
Select the ellipsis (...) menu and then select Power Pages Management.
The Power Pages Management App opens in a new tab.

Select Site Settings.
Select + New and then enter the following information:
Name - Webapi/account/enabled
Website - Select your website
Value - true
Select Save.

Select + New and then enter the following information:
Name - Webapi/account/fields
Website - Select your website
Value - name,numberofemployees,revenue
Select Save & Close.


Create table permissions
To create table permissions, follow these steps.
Switch to Power Pages home.
Select Edit for the target website to open Power Pages design studio.
Select the *Security workspace and then select Table permissions.

Select + New permission and then fill in the following information:
Name - Account
Table - Account (account)
Access type - Global
Permission to - Read
Select Add roles and then add Anonymous Users and Authenticated Users.
Select Save.


Test the Web API
To test the Web API, open the following URL: https://yourwebsite.powerappsportals.com/_api/accounts?$select=name,numberofemployees,revenue
Your output should resemble the following image.

Create a content page and retrieve data
To create a content page and add JavaScript code that retrieves and transforms the data, follow these steps:
In design studio, select the Pages workspace, then select + Page.
Enter Chart as the Page name.
Confirm selection of the option to Add page to main navigation.
Select the Start from blank layout.
Select Add.
Select Edit code.

In the pop-up dialog, select Open Visual Studio Code.
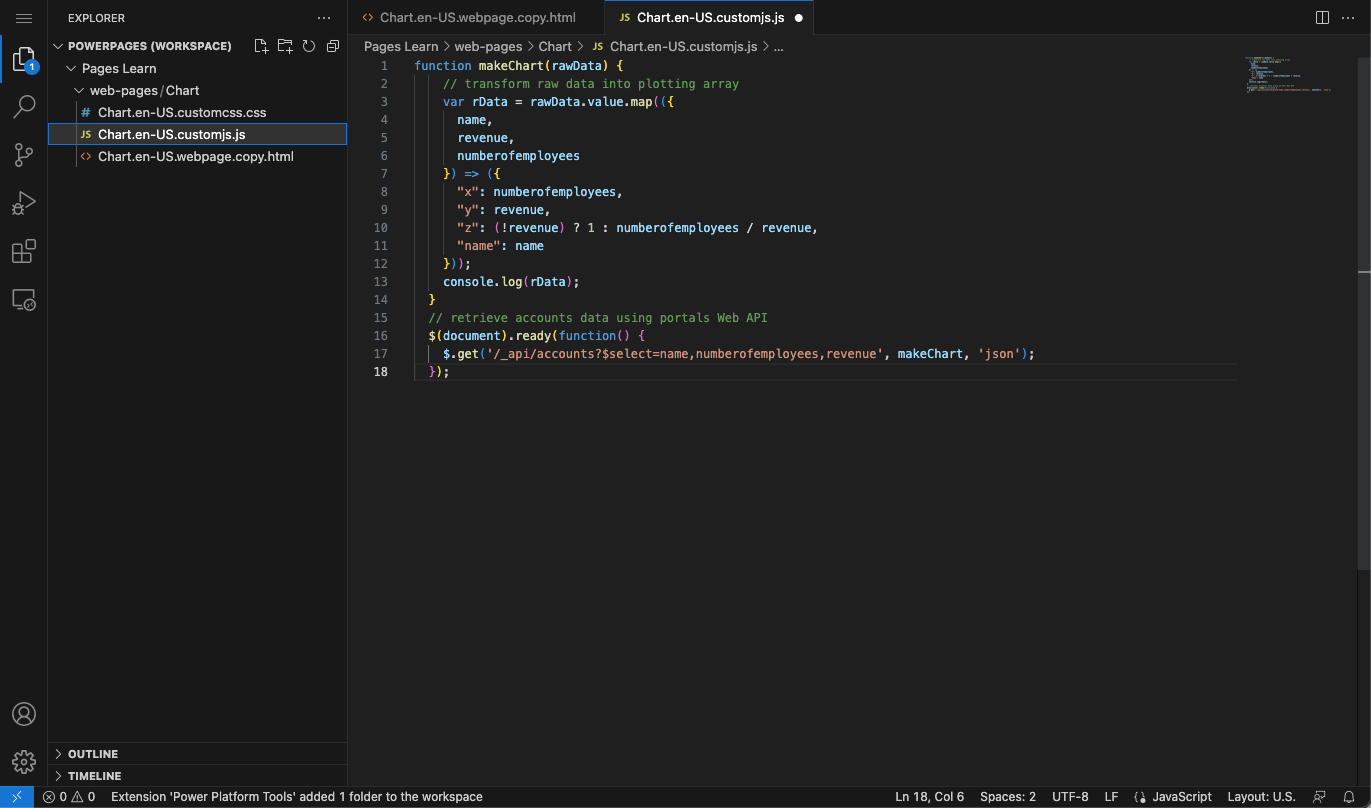
In the Visual Studio Code editor, select the Chart.en-US.customjs.js file.
Append the following script:
function makeChart(rawData) {
  // transform raw data into plotting array
  var rData = rawData.value.map(({
    name,
    revenue,
    numberofemployees
  }) => ({
    "x": numberofemployees,
    "y": revenue,
    "z": (!revenue) ? 1 : numberofemployees / revenue,
    "name": name
  }));
  console.log(rData);
}
// retrieve accounts data using portals Web API
$(document).ready(function() {
  $.get('/_api/accounts?$select=name,numberofemployees,revenue', makeChart, 'json');
});
Press the Ctrl + S keyboard shortcut (⌘ + S on Mac) to save the file.
Close the Visual Studio Code tab. Select Sync when prompted to synchronize the changes.
Select Preview > Desktop.
When the page is displayed, press the F12 key to display browser developer tools.
Verify that the console output contains the same data as previously retrieved, except that it's now showing as transformed.
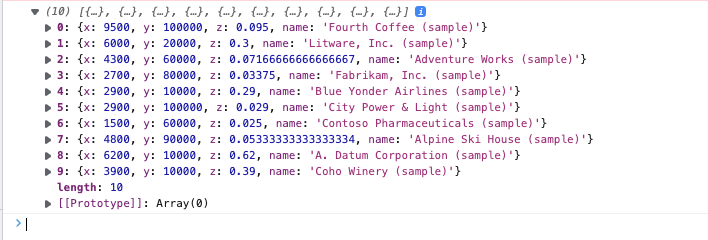
The data structure is now prepared for plotting. Assign the appropriate labels to data points:
name - Company name
x - Number of employees
y - Company revenue in thousands
z - Revenue for each employee (calculated)


Add external library functionality
This exercise uses the Highcharts.js library (free for personal or non-profit use) to create a bubble chart based on the data.
Switch to design studio.
Select the page footer and then select Edit code.
In the pop-up dialog, select Open Visual Studio Code.

Append the following code at the end of the file.
  <script src="https://code.highcharts.com/highcharts.js"></script>
  <script src="https://code.highcharts.com/highcharts-more.js"></script>
Press the Ctrl + S keyboard shortcut (⌘ + S on Mac) to save the file.
Close the Visual Studio Code tab.
Select Edit code on the toolbar to open Visual Studio Code for the page.
Select the Chart.en-US.customjs.js file.
Modify the file to change the makeChart function as follows:
function makeChart(data) {
  console.log(data);
  var rData = data.value.map(({
    name,
    revenue,
    numberofemployees
  }) => ({
    "x": numberofemployees,
    "y": revenue,
    "z": (!revenue) ? 1 : numberofemployees / revenue,
    "name": name
  }));
  console.log(rData);

  // new code to plot the data
  Highcharts.chart($('.mychart')[0], {
    title: {
      text: "Customers efficiency"
    },
    legend: {
      enabled: false
    },
    xAxis: {
      title: {
        text: "Number of employees"
      }
    },
    yAxis: {
      title: {
        text: "Turnover ($K)"
      }
    },
    tooltip: {
      pointFormat: '<strong>{point.name}</strong><br/>Employed: {point.x}<br>Turnover ($K): ${point.y}',
      headerFormat: ''
    },
    series: [{
      type: 'bubble',
      data: rData
    }]
  });
}

// retrieve accounts data using portals Web API
$(document).ready(function() {
  $.get('/_api/accounts?$select=name,numberofemployees,revenue', makeChart, 'json');
});
Press the Ctrl + S keyboard shortcut (⌘ + S on Mac) to save the file.
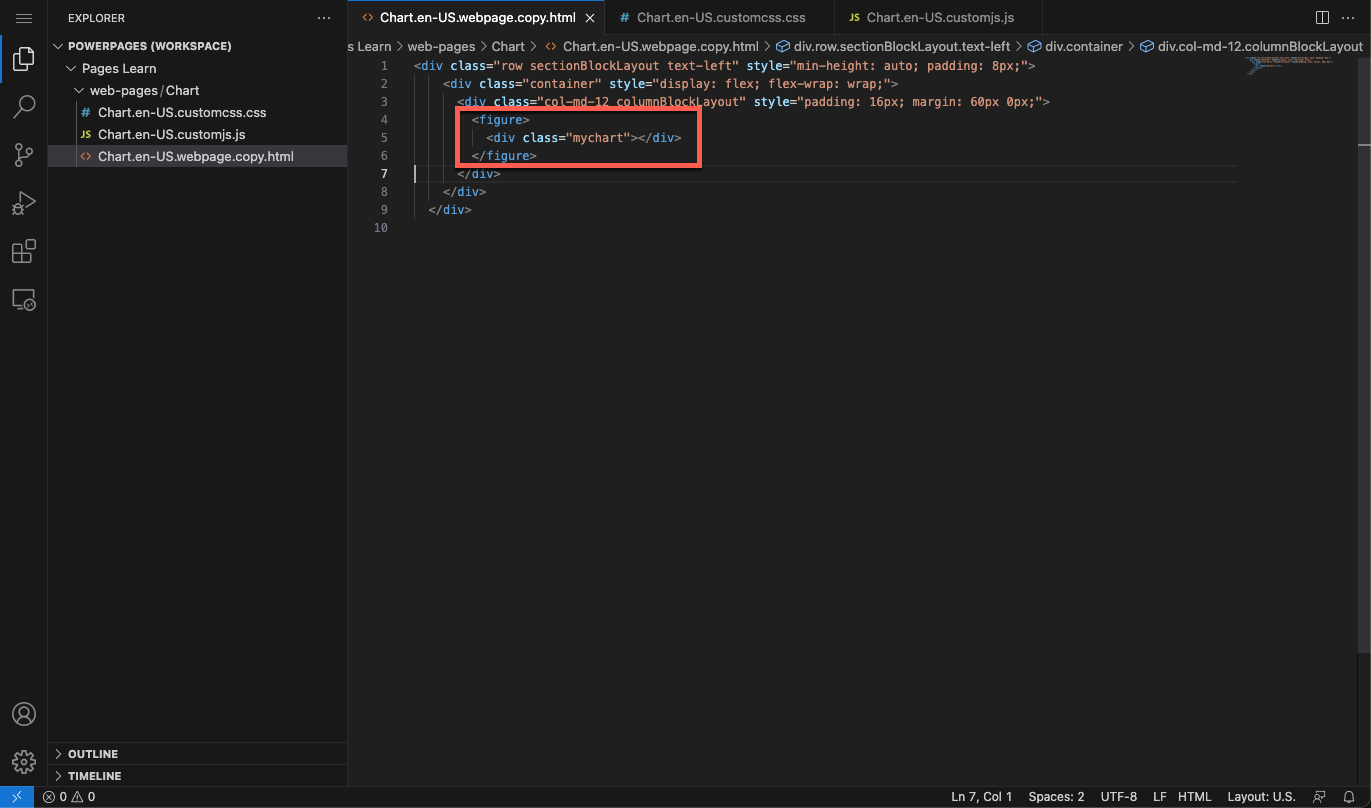
Select the Chart.en-US.webpage.copy.html file.
Insert the following code into the inner
<div>element:<figure> <div class="mychart"></div> </figure>Press the Ctrl + S keyboard shortcut (⌘ + S on Mac) to save the file.
Close the Visual Studio Code tab then select Sync to synchronize the changes.
Select Preview > Desktop.
The output should now include the bubble chart. Hover your cursor over the bubbles to verify the data.


