Transform data with operators
While many operators in Data Wrangler are intuitive and easy to use, others require a deeper understanding to fully use them.
Use one-hot encoding operator
Some machine learning models, such as linear regression, require all input and output variables to be numeric and don't support categorical variables. Categorical data refers to variables that are divided into multiple categories which don't carry a numerical value or order.
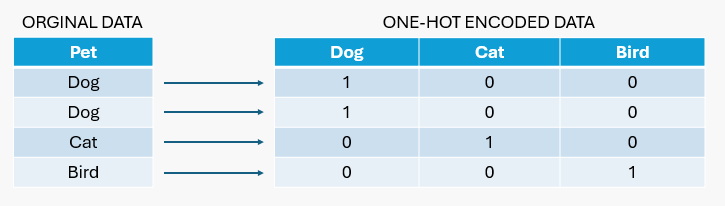
In one-hot encoding, each category in a feature is represented as a binary vector of 1's and 0's.
For example, if you have a pet variable with the values dog, cat, and bird, three new variables are created (one for each pet type). For each data point, it marks 1 for the pet it represents and 0 for the others. So, if a data point represents a dog, it's encoded as [1, 0, 0]. If it’s a cat, it's [0, 1, 0], and if it’s a bird, it's [0, 0, 1].
Note
One-hot encoding can lead to increased dimensionality, which is when the number of features in the dataset becomes very large. This is particularly the case when the categorical variable has many unique values.
Let's create a dataframe based on the pet example above, and use Data Wrangler to generate the code for one-hot encoding.
import pandas as pd

# Sample dataset with 50 data points, including duplicates
data = {'pet': ['dog', 'dog', 'cat', 'cat', 'bird', 'bird']*8 + ['bird', 'cat']}
df = pd.DataFrame(data)

print(df.head(10))
The following steps show how to use the one-hot encode operator for the pet variable.
Launch Data Wrangler from a Microsoft Fabric notebook for the
dfdataframe.Select the
petvariable.On the Operations panel, select Formulas, and then One-hot encode.
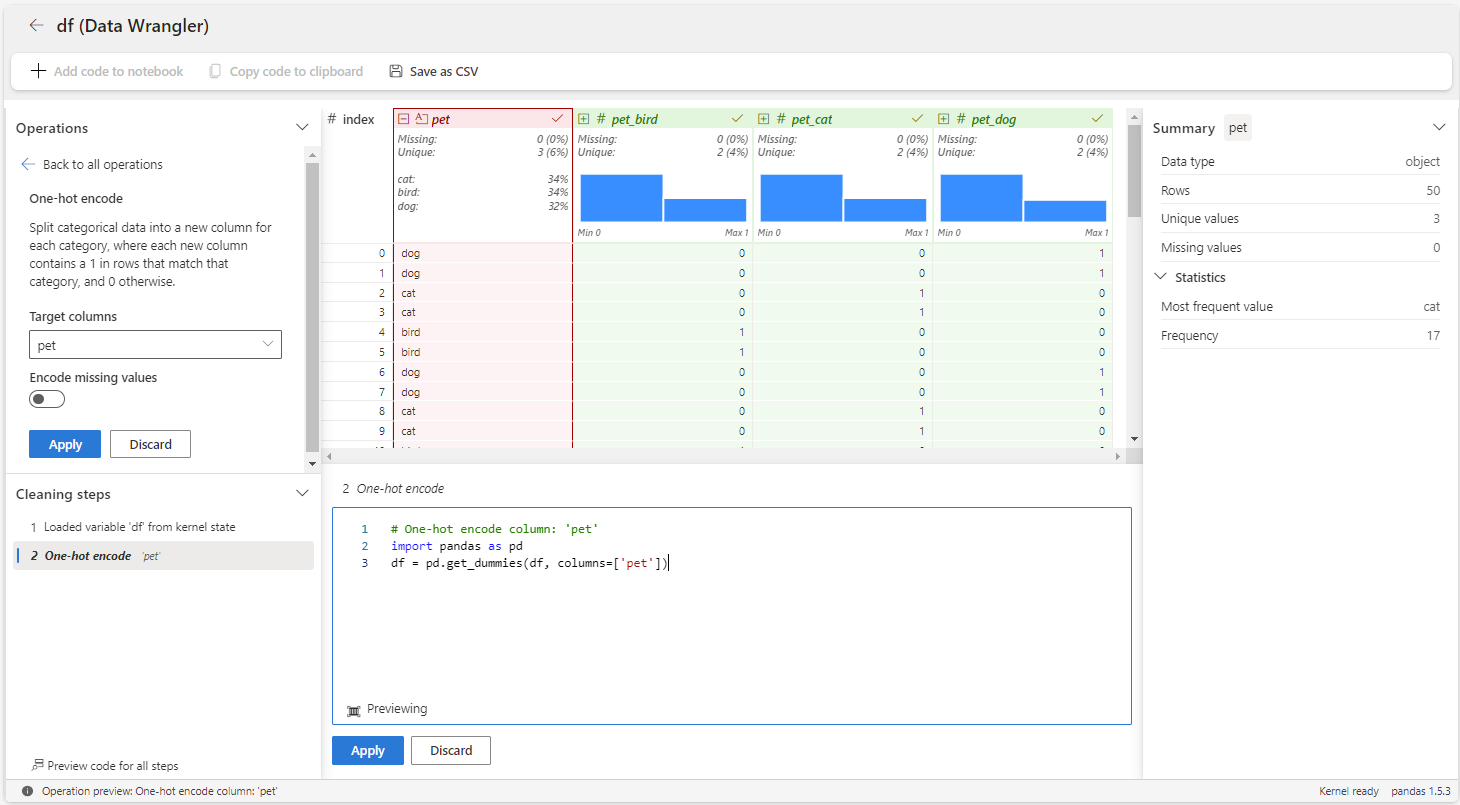
Select Apply.
Select + Add code to notebook in the toolbar above the Data Wrangler grid. This generates a function that you can then execute in your data pipeline.
Use the multi-label binarizer operator
One-hot encoding is used when each data point belongs to exactly one category. On the other hand, the multi-label binarizer operator is used when each data point can belong to multiple categories.
The multi-label binarizer operator allows you to split categorical data into a new column for each category using a text split delimiter, where each new column contains a one in rows that match that category, and 0 otherwise.
For training purposes, let's create a dataframe about food category, and use Data Wrangler to generate the code for multi-label binarizer.
import pandas as pd

#Sample data
data = {
    'food': ['Pasta', 'Burger', 'Ice Cream', 'Salad'],
    'category': ['Italian|Fine dining', 'American|Fast Food', 'Dessert', 'Healthy']
}

# Create DataFrame
restaurant = pd.DataFrame(data)
Then, the following steps show how to use the multi-label binarizer operator for the category variable.
Launch Data Wrangler from a Microsoft Fabric notebook for the
restaurantdataframe.Select the
categoryvariable.On the Operations panel, select Formulas, and then Multi-label binarizer.
Type | as the delimeter.
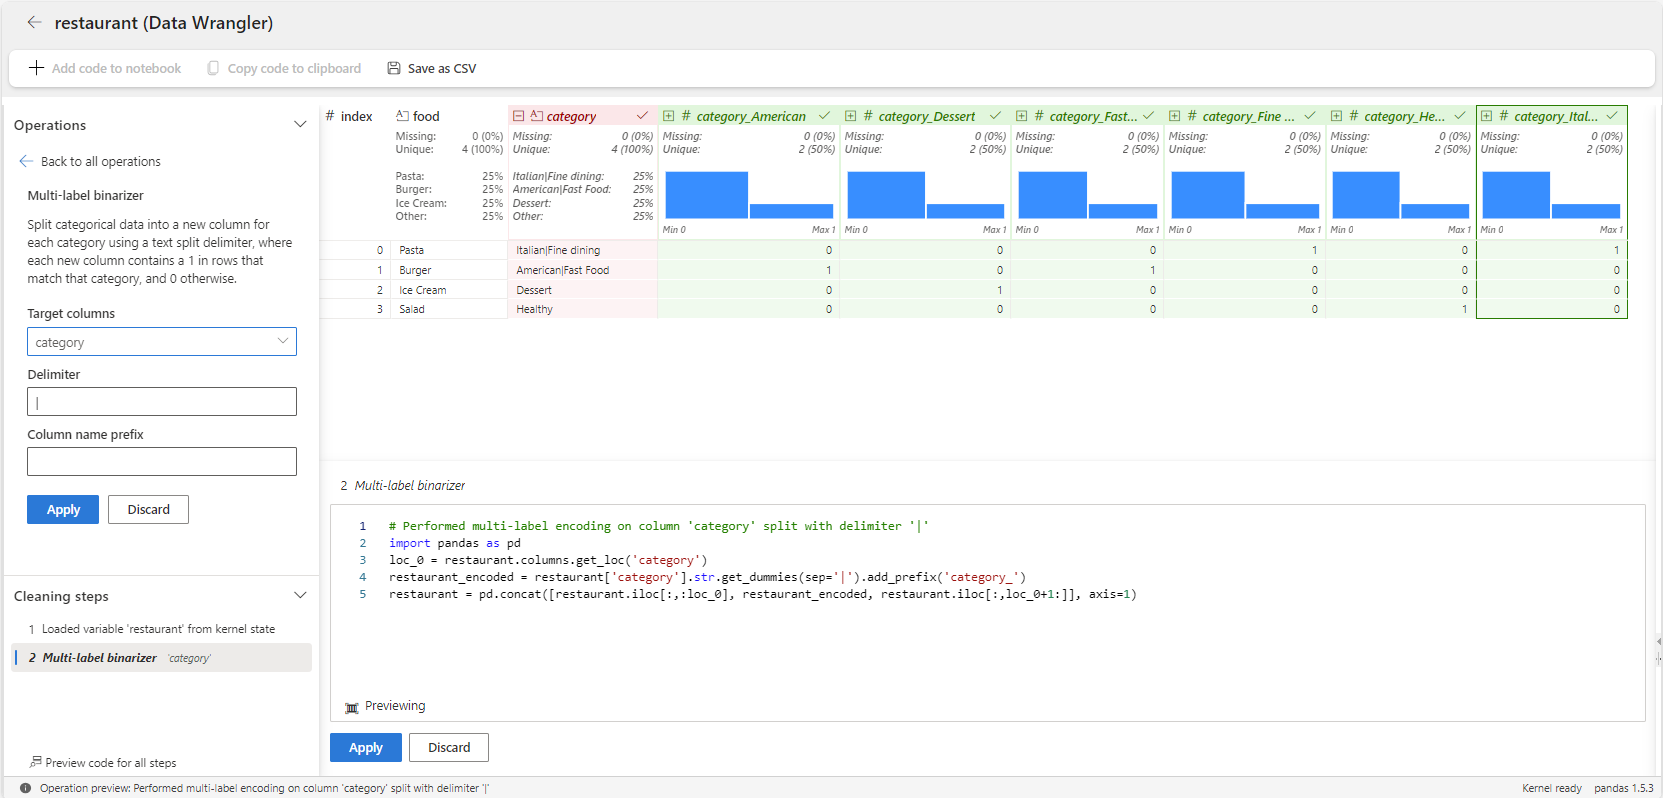
The result is a dataframe with variables for each category like American, Dessert, Fast Food, Healthy, and Italian. Each food item is marked with 1's or 0's in these columns to show which categories it belongs to. For instance, both Pizza and Burger fall under multiple categories.
Select Apply.
Select + Add code to notebook in the toolbar above the Data Wrangler grid. This generates a function that you can then execute in your preprocessing pipeline.
Use min-max scaling operator
Min-max scaling or min-max normalization is the process of transforming a numerical feature. This process scales the range of your data while preserving the shape of the original distribution and the relationships among variables.
It ensures that the significance of a feature is determined by its relative value, not its absolute value. In other words, features are not considered more important simply because they have larger scales.
It takes each value in your data, subtracts the minimum value of that data, and then divides by the range of the data (the maximum value minus the minimum value).
The result is that your data is rescaled to a range of 0 to 1 typically, which can be useful for certain types of machine learning algorithms, particularly those that use distance measures like K-Nearest Neighbors.
Let's consider a dataframe that represents the grades of students in a class. The dataframe has three columns: Student, Math_Grade, English_Grade, and Hours_Studied.
import pandas as pd

# Sample data
data = {
    'Student': ['Bob', 'Mark', 'Anna', 'David', 'Sam'],
    'Math_Grade': [85, 90, 78, 92, 88],
    'English_Grade': [80, 85, 92, 88, 90],
    'Hours_Studied': [250, 500, 355, 245, 199]
}

df = pd.DataFrame(data)

print(df)
The output is:
  Student  Math_Grade  English_Grade  Hours_Studied
0     Bob          85             80            250
1    Mark          90             85            500
2    Anna          78             92            355
3   David          92             88            245
4     Sam          88             90            199
Now, let's apply min-max scaler to the Math_Grade, English_Grade, and Hours_Studied variables using Data Wrangler. For this, you need to use the Scale min/max values operator under the Numeric category.
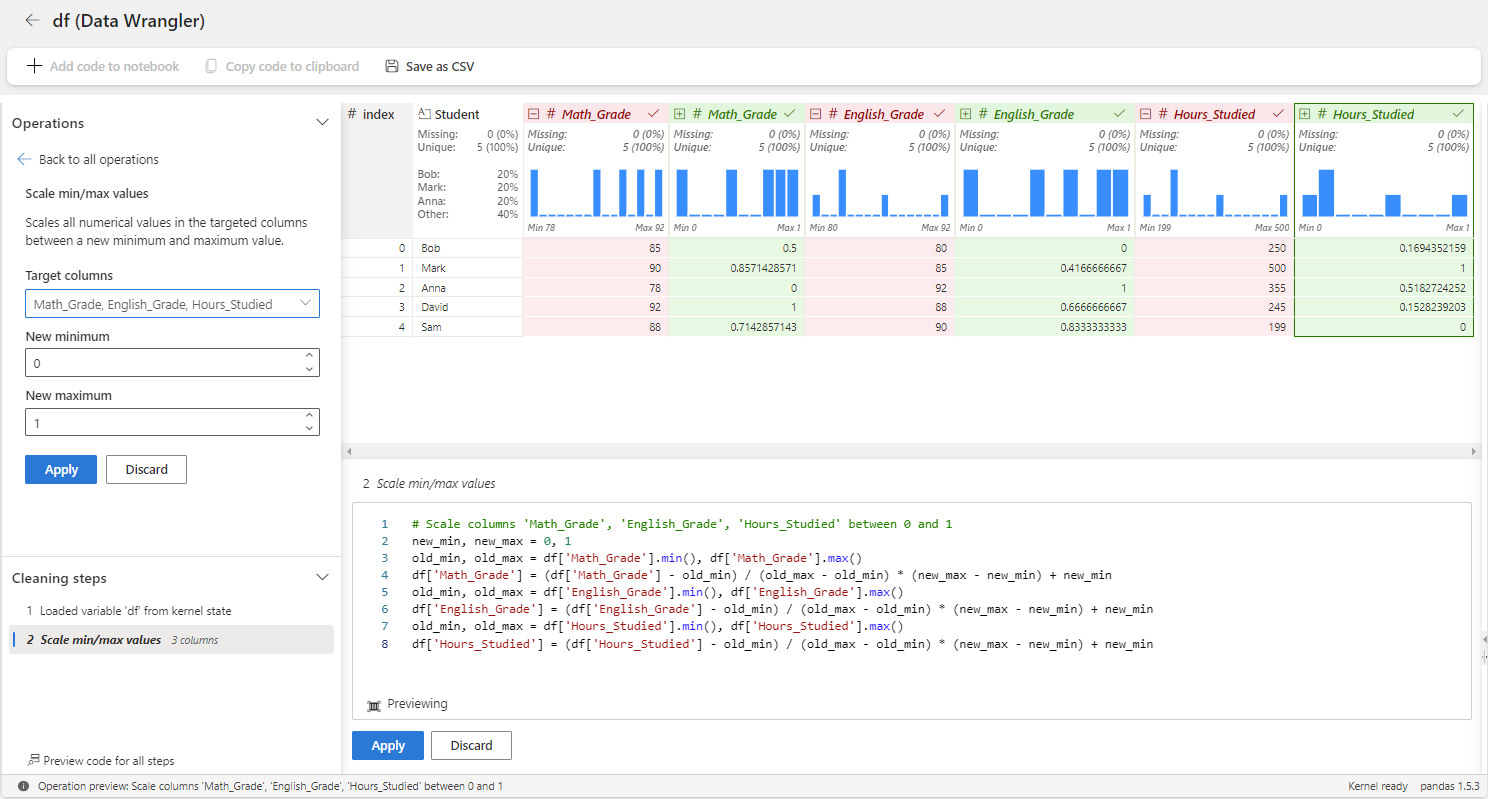
In the above, the grades are scaled to fall within the range of [0, 1], with the minimum grade mapped to 0 and the maximum grade mapped to 1. Other grades are scaled proportionally within this range. You can also adjust the minimum and maximum range.
If you use features like Math_Grade, English_Grade, and Hours_Studied in a distance-based machine learning algorithm such as K-Nearest Neighbors without first scaling them, you might encounter some issues.
The Hours_Studied feature could potentially dominate the other features due to its larger range of values. This could lead to a model that heavily relies on Hours_Studied, while ignoring Math_Grade and English_Grade. So, it’s important to scale your data in those cases to ensure all features are given equal importance.
To learn more about data normalization for machine learning models, see Data transformations.