Clean the data and check for correlations
We know from experience that we'll probably need to clean up some of our data before we can run the machine learning algorithms that we want to run.
Handle null values
Because we're working with a real-world dataset, it's a safe bet that the dataset contains null values. Later, we'll transform our data by using a function that cannot use NaN values. Let's drop rows that contain those values now.
Try it yourself
Drop rows from the DataFrame that contain NaN values.
If you need help with remembering which method to use, see the pandas documentation.
The exercise solution is:
df.dropna()
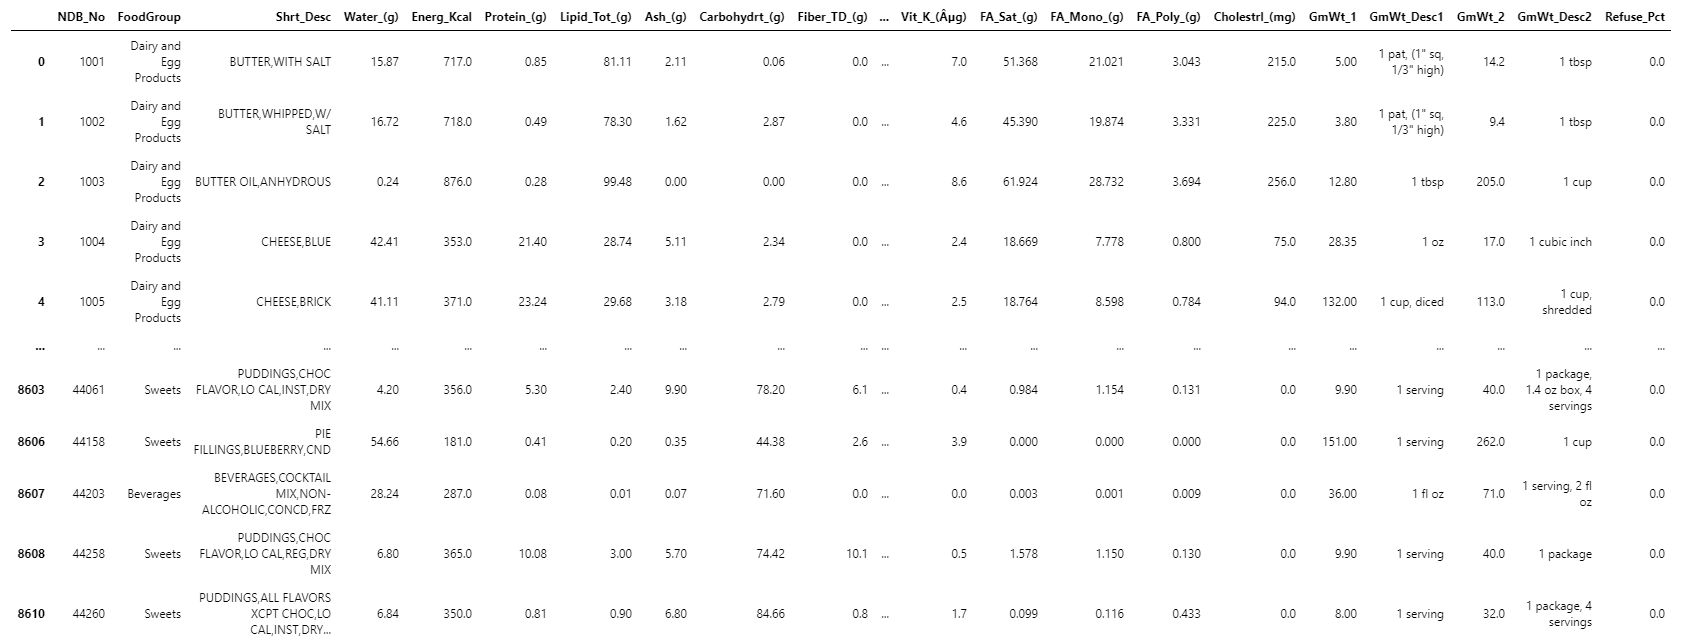
The output is:
Now, let's see how many rows we have left:
df.shape
The output is:
(2190, 54)
Dropping those rows eliminated 76 percent of our data (from 8,989 entries to 2,190 entries). It's an imperfect result, but we still have enough for our purposes.
Tip
Key takeaway
Another solution to removing null values is to impute values for them, but this can be tricky. Should we handle missing values as equal to 0? What about a fatty food with NaN for Lipid_Tot_(g)? We might try taking the averages of values surrounding a NaN, but what about foods that are right next to rows that contain foods from radically different food groups? It's possible to make justifiable imputations for missing values, but it can be important to involve subject matter experts (SMEs) in that process.
Split off descriptive columns
Our descriptive columns (such as FoodGroup and Shrt_Desc) pose challenges for us when it comes time to perform PCA because they're categorical rather than numerical features. So, we'll split our DataFrame into two. One contains the descriptive information, and one contains the nutritional information:
desc_df = df.iloc[:, [0, 1, 2]+[i for i in range(50,54)]]
desc_df.set_index('NDB_No', inplace=True)
desc_df.head()
The output is:
-----------------------------------------------------------------------------------------------------------
|        | FoodGroup     | Shrt_Desc           | GmWt_Desc1          | GmWt_2 | GmWt_Desc2   | Refuse_Pct |
-----------------------------------------------------------------------------------------------------------
| NDB_No |               |                     |                     |        |              |            |
----------------------------------------------------------------------------------------------------------|
| 1001   | Dairy and Egg | BUTTER,WITH SALT    | 1 pat, (1" sq. 1/3" | 14.2   | 1 tbsp       | 0.0        |
|        | Products      |                     | high)               |        |              |            |
----------------------------------------------------------------------------------------------------------|
| 1002   | Dairy and Egg | BUTTER,WHIPPED,W/   | 1 pat, (1" sq. 1/3" | 9.4    | 1 tbsp       | 0.0        |
|        | Products      |                     | high)               |        |              |            |
----------------------------------------------------------------------------------------------------------|
| 1003   | Dairy and Egg | BUTTER OIL,ANYDROUS | 1 tbsp              | 205.0  | 1 cup        | 0.0        |
|        | Products      |                     |                     |        |              |            |
----------------------------------------------------------------------------------------------------------|
| 1004   | Dairy and Egg | CHEESE,BLUE         | 1 oz                | 17.0   | 1 cubic inch | 0.0        |
|        | Products      |                     |                     |        |              |            |
----------------------------------------------------------------------------------------------------------|
| 1005   | Dairy and Egg | CHEESE,BRICK        | 1 cup, diced        | 113.0  | 1 cup,       | 0.0        |
|        | Products      |                     |                     |        | shredded     |            |
-----------------------------------------------------------------------------------------------------------
Try it yourself
Why was it necessary to structure the iloc method call the way we did in the preceding code? What did it accomplish? Why was it necessary to set the desc_df index to NDB_No?
Running the following code helps you answer the questions:
nutr_df = df.iloc[:, :-5]
nutr_df.head()
The output is:
Try it yourself
Now, set the index of nutr_df to use NDB_No.
nutr_df.set_index('NDB_No', inplace=True)
Let's take a look at nutr_df now, and see how it's changed:
nutr_df.head()
The output is:
Check for correlation among features
One thing that can skew our classification results is correlation among our features. Recall that the whole reason PCA works is that it exploits the correlation among data points to project our feature space into a lower-dimensional space. But if some of our features are highly correlated to begin with, these relationships might create spurious clusters of data in our PCA.
The code to check for correlations in our data isn't long, but it takes too long (up to 20 minutes) to run for our purposes. The following table shows the output from that code:
------------------------------------------------
|   | column          | row             | corr |
------------------------------------------------
| 0 | Folate_Tot_(µg) | Folate_DFE_(µg) | 0.98 |
------------------------------------------------
| 1 | Folic_Acid_(µg) | Folate_DFE_(µg) | 0.95 |
------------------------------------------------
| 2 | Folate_DFE_(µg) | Folate_Tot_(µg) | 0.98 |
------------------------------------------------
| 3 | Vit_A_RAE       | Retinol_(µg)    | 0.99 |
------------------------------------------------
| 4 | Retinol_(µg)    | Vit_A_RAE       | 0.99 |
------------------------------------------------
| 5 | Vit_D_µg        | Vit_D_IU        | 1    |
------------------------------------------------
| 6 | Vit_D_IU        | Vit_D_µg        | 1    |
------------------------------------------------
It turns out that dropping Folate_DFE_(µg), Vit_A_RAE, and Vit_D_IU eliminates the correlations enumerated in the preceding table:
nutr_df.drop(['Folate_DFE_(µg)', 'Vit_A_RAE', 'Vit_D_IU'],
        inplace=True, axis=1)
nutr_df.head()
The output is:


