Analyze survey results
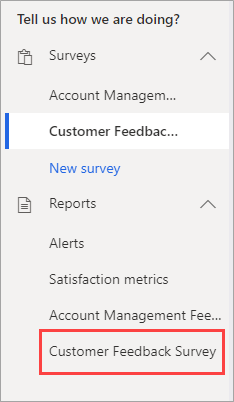
When a project is created in Dynamics 365 Customer Voice, a minimum of one survey is always created by default. Each survey has a corresponding report area that is created at the same time. Creating surveys in a project generates a new survey response report to go along with it. The surveys and reports are listed alphabetically, helping you more easily find the correct report for the survey that is being reviewed.
After you have selected the name of the report, the survey responses will be displayed by using graphical representations of all responses for that specific report. Each question on the survey is included, and they are listed numerically in the same order that you added them in the report design area. The total number of received responses for the survey are displayed in the upper-left corner and include all responses, regardless of how they were generated. Essentially, anonymous responses are included along with responses that came from a personalized survey invitation, where the responder is known and exists as a contact in the associated Microsoft Dataverse environment.
Variables that are used within the survey in question text will be displayed as the variable name surrounded by braces {}, which shows where personalization has been used within the survey. Different question types are represented by using different types of graphics. For example, a pie chart is used for choice questions, and a gauge is used for the Net Promoter Score type question. Text questions use a number to indicate how many responses were received with a specific populated question, and text from the latest responses is shown. Ratings questions are displayed as bar charts, with the average rating shown by using a star, number, or smiley indicator, depending on the symbol that you selected when creating the survey and adding the rating question.
You can access individual responses from the Respondents menu on the right side of the survey response report. Responses will be displayed as anonymous when no contact has been linked to it. Alternatively, if the response was submitted from a unique personalized survey invitation, it will include the name and email of the respondent. The Response tab provides all survey questions with the responses that were given for this specific respondent. As with the main survey response report, questions that included a variable will only display the name of the variable in braces {} and will not display the actual value that might have been passed through to the variable.
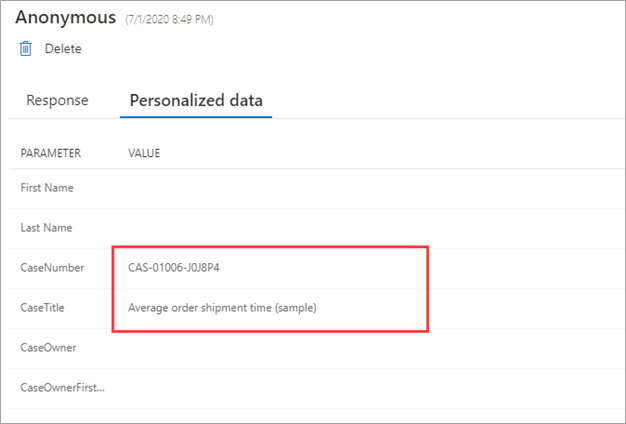
Selecting the Personalized data tab from an individual survey response will provide details of variable values that were stored. You can pass through these values in many ways:
Set a value as the default value on a variable prior to sharing the survey link.
Pass through the survey link by using the custom links functionality.
Upload a CSV file by using an advanced template that contains variables.
Create a flow in Microsoft Power Automate and pass through the variables by using the Create an invitation action from the Dynamics 365 Customer Voice connector.
Watch the following video for a quick demonstration.


