Knowledge article analytics
Organizations can invest considerable time in building a knowledge management system. Time-oriented tasks in building the system include the time that's spent by content authors in creating the content, the time that's invested in making sure that it's accurate and approved, and the maintenance that's involved in keeping content relevant and current. With all the invested time, it's critical that the content is being consumed. Several elements can impact the consumption of articles, such as when articles don't have the most relevant content, when they're not easy to consume, or if they're difficult to find.
The knowledge analytics that are available in Dynamics 365 Customer Service help provide important insights about how knowledge articles are being used and searched. Supervisors can use these insights to improve their knowledge management system. For example, when analyzing the actual search terms that are being used, you might discover that the actual number of articles that are being suggested is low. You could add other or different keywords to your articles to ensure that they're being suggested to users as they search for content.
Knowledge analytics includes the following features:
Article insights - Show the impact that knowledge management makes.
Search term analytics - Provide insights that are related to how service representatives find and use knowledge articles.
Article insights
The Article insights dashboard can help your organization's knowledge content authors understand the impact that knowledge management can make on the overall support experience. This dashboard also includes information, such as how many times an article has been viewed or how many times the article was shared.

The Article insights dashboard provides the following metrics.
| Metrics or chart | Definition |
|---|---|
| Views | The total number of views on the knowledge articles. |
| Visitors | The total number of unique visitors who viewed the knowledge articles. |
| Feedback rating | The average feedback rating that's provided by the consumers of the knowledge articles. |
| Most viewed articles | The top 20 articles used, along with visitors, average feedback rating, linked cases, and shares metrics. |
| Linked cases | The total number of cases that were linked to the articles. |
| Shares | The total number of times that the support representative shared the article. |
| Owner (Filter) | The owner of the knowledge article. |
Search term analytics
Knowledge managers are responsible for maintaining and improving your organization's overall knowledge base article offerings. To help with this process, the Knowledge search term analytics dashboard provides supervisors and knowledge workers with valuable insights into how service representatives find and use knowledge articles. By identifying searches with low or no results, you can identify gaps in content, modify article content to improve search results, and show the most relevant articles.

The Knowledge search term analytics dashboard includes the following metrics.
| KPIs or chart | Definition |
|---|---|
| Search count | The total number of searches that are completed within a given period. |
| Search count over duration | The number of searches that are completed within a certain amount of time. |
| Avg. search rate trend | The day-by-day trend of the average list position of the link that's selected by a user when presented with search results. |
| Avg. search rank | The average position of the link that's selected by a user when presented within search results. |
| Engagement rate | The percentage of events where a user interacted with the search results compared to the search events that are presented with results. |
| Engagement rate trend | The day-by-day trend of the percentage of events where a user interacted with the search results compared to the search events that are presented with results. |
| Rate of no-result searches | Percentage of instances where the searched term displayed no results. |
| Rate of no-result searches trend | The day-by-day trend of the percentage of search instances that displayed no results. |
| Top 20 search terms | The top 20 terms being searched, showing the number of times searched, the average search rate, and engagement rate. |
| Top 20 search terms with no results | The top 20 search terms that returned no results when searched. |
| Top 20 search terms with high avg. search rank | The top 20 search topics by volume with an average click position of greater than five. |
| Top 20 search terms with low engagement rate | The top 20 search topics by volume with engagement rate of less than 40 percent. |
| Search volume by application | The percentage of searches across multiple applications. |
| Search volume by search type | The percentage of searches based on whether they were manual or automatic searches. |
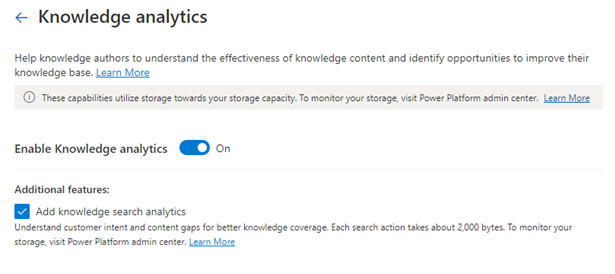
Enable knowledge analytics
You can enable the Knowledge search analytics dashboard in the Customer Service admin center. You can access the Knowledge analytics page by going to the Operations group and selecting Insights. After you've turned on the Enable Knowledge analytics toggle, you can also select the Add knowledge search analytics option.
After you've enabled the knowledge analytics reports, you can access them in the Customer Service Hub and Customer Service workspace user interfaces.
Customer Service Hub - Go to Service > Insights > Knowledge analytics page. Search term insights are displayed.
Customer Service workspace - On the Application tab, select Knowledge analytics.