Monitor of Azure Arc-enabled SQL Managed Instance
Although the primary purpose of managed solutions is to lower administrative overhead, it is equally important to have proper oversight of these solutions. Such oversight is particularly relevant when you use Azure Arc services, with the underlying infrastructure residing in your own datacenters.
Monitoring options
Azure Arc-enabled SQL Managed Instance provides several options to deliver this oversight functionality with built-in support for the following monitoring capabilities:
- Grafana. This tool provides a web-based metrics dashboard that facilitates real-time monitoring of your data services.
- Kibana: This tool provides a web-based interface that simplifies log collection, searching, and visualization.
- Azure Monitor: This service represents an Azure portal-accessible solution that helps you track and analyze an operational status of your entire managed environment.
For metrics and logs monitoring data services operating in the indirectly connected mode, you can leverage your experience with open-source solutions such as Grafana and Kibana dashboards. To deliver a unified monitoring solution that provides a single pane of glass for cloud-based and on-premises workloads, including databases residing in the overseas datacenters, consider using Azure Monitor. Although you can also use Azure Monitor to track usage metrics of the databases hosting the US government contracts data, this would require exporting and uploading telemetry to Azure.
Grafana
Grafana is an open-source monitoring and analytics solution for databases that Azure Arc-enabled SQL Managed Instance supports in the directly and indirectly connected modes. To access Grafana dashboards, connect from Azure Data studio to Azure Arc data controller, right-click or access the context menu for the entry representing your Azure Arc-enabled SQL Managed Instance, and then select Manage.
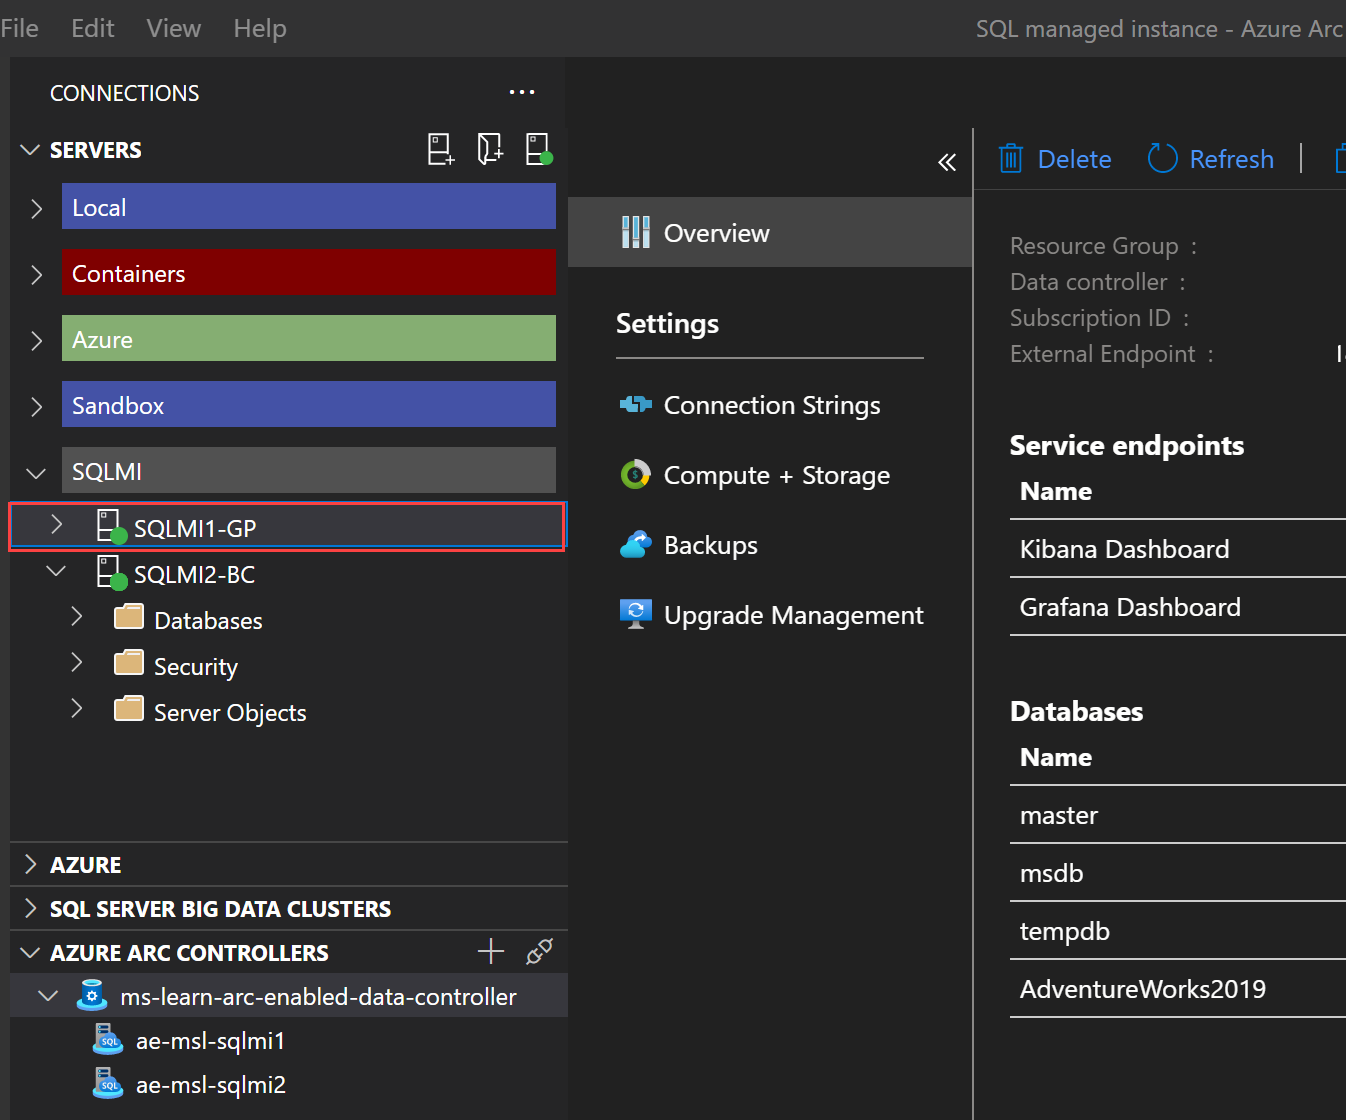
To access the Grafana dashboard, target the Grafana Dashboard endpoint, which is available in the Azure Data studio interface as the preceding screenshot illustrates. Alternatively, you can identify it by running the az sql mi-arc endpoint list Azure CLI command. When prompted, sign in with Metrics and Logs dashboard credentials you specified when deploying the data controller.

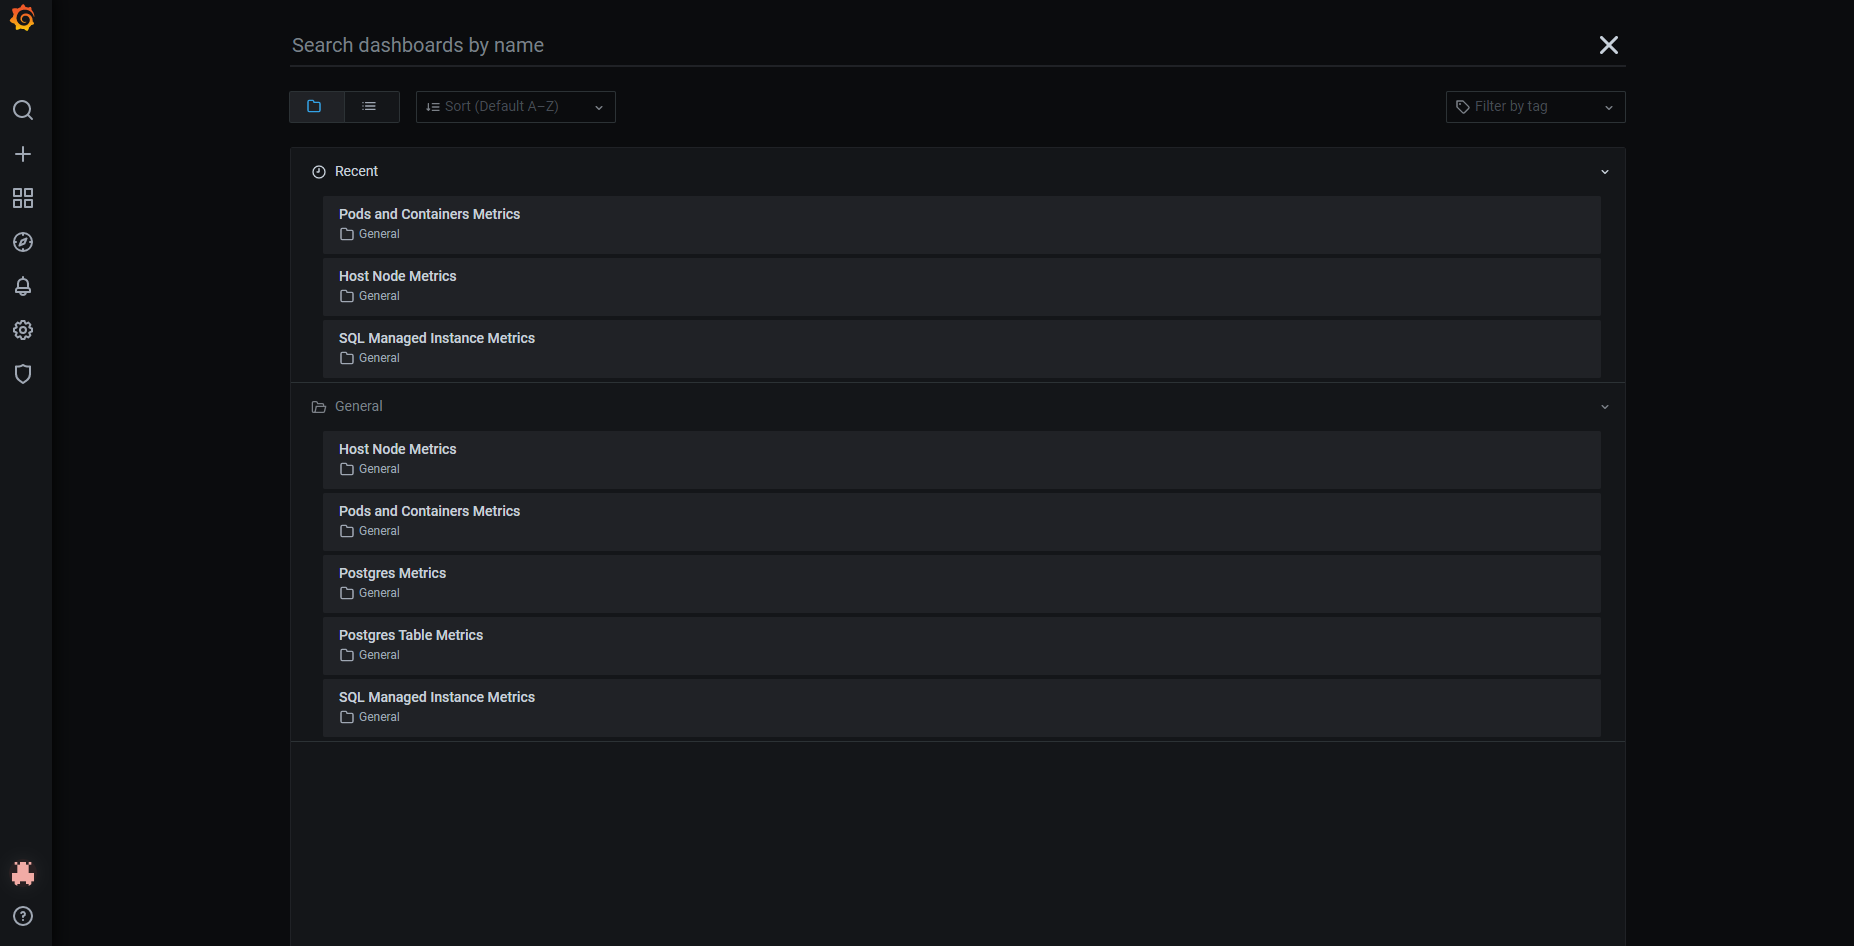
From the main interface, you can access several additional dashboards that provide a view of the:
- Kubernetes host node metrics
- Kubernetes pods and container metrics
- Azure Arc-enabled SQL Managed Instance metrics
Kibana
Kibana is an open-source solution that provides powerful data search and visualization capabilities. Kibana is optimized for searching and visualizing data originating from:
- Logs and log analytics
- Infrastructure metrics and container monitoring
- Application performance monitoring
- Geospatial data analysis and visualization
- Security analytics
- Business analytics
Similar to Grafana, you can access Kibana using a designated endpoint as part of your Azure Arc data controller deployment in both the directly and the indirectly connected modes. You can also access it by authenticating with Metrics and Logs dashboard credentials you specified when deploying the data controller. Kibana Query Language (KQL) offers a simple syntax for log filtering using free text or field-based search. Within Kibana, you can create dashboards and visualizations to cater to your specific needs.
Note
Kibana Query Language is distinct from Kusto Query Language (KQL), which is used with Azure Log Analytics.

Azure Monitor
Azure Monitor delivers a comprehensive solution for collecting, analyzing, and acting on logs and metrics from cloud and on-premises environments. It provides a single pane of glass for monitoring all of your Azure Arc-enabled data services and reviewing their metrics in easy-to-understand graphs. Azure Monitor also supports alerting, including the ability to automatically respond to and remediate error conditions. You can use Azure Monitor in both the directly connected and the indirectly connected modes.

In the directly connected mode, you can use automatic export and import of logs and metrics from the Azure Arc data controller to Azure Monitor. In the indirectly connected mode, the equivalent process involves exporting logs and metrics from the data controller and uploading them to Azure Monitor. Although, this is optional, we recommended following this process because it allows you to leverage cloud for long-term storage and advanced analytics. It also provides you with a comprehensive inventory of all of your managed data services.

For log collection, you must first identify an existing Log Analytics workspace or provision a new one. Next, you need to retrieve the workspace id and one of two workspace keys, and then store them as values of environment variables within an Azure CLI session. When operating in the directly connected mode, you must enable automatic upload. You can configure automatic upload by running the az sql mi-arc update command with the --auto-upload-metrics and --auto-upload-logs parameter (respectively) set to true. When operating in the indirectly connected mode, use the az arcdata dc export and az arc data upload commands. To provide a security context for metrics uploads in the indirectly connected mode, you must use a service principal with the Monitoring Metrics Publisher role. In the directly connected mode, you rely instead on the Azure Arc data services extension managed identity with the Monitoring Metrics Publisher role.