Exercise - Monitor performance of Azure Arc-enabled SQL Managed Instance
An Azure Arc-enabled SQL Managed Instance deployment out of the box provides the ability to monitor the environment locally using Azure Data Studio and Grafana. In this exercise, you will look at how to access Grafana and what metrics are captured and provided by default.
Utilizing the Grafana dashboards locally in your Arc-enabled SQL Managed Instance environment will provide you insights into the infrastructure (Kubernetes Cluster) as well as the performance of the Arc-enabled SQL Managed Instance.
Open Azure Data Studio.
Expand the Connections Tab.
Expand Azure Arc Controllers.
Expand your Arc data controller.
Right-click on your Arc-enabled SQL Managed Instance and select Manage.
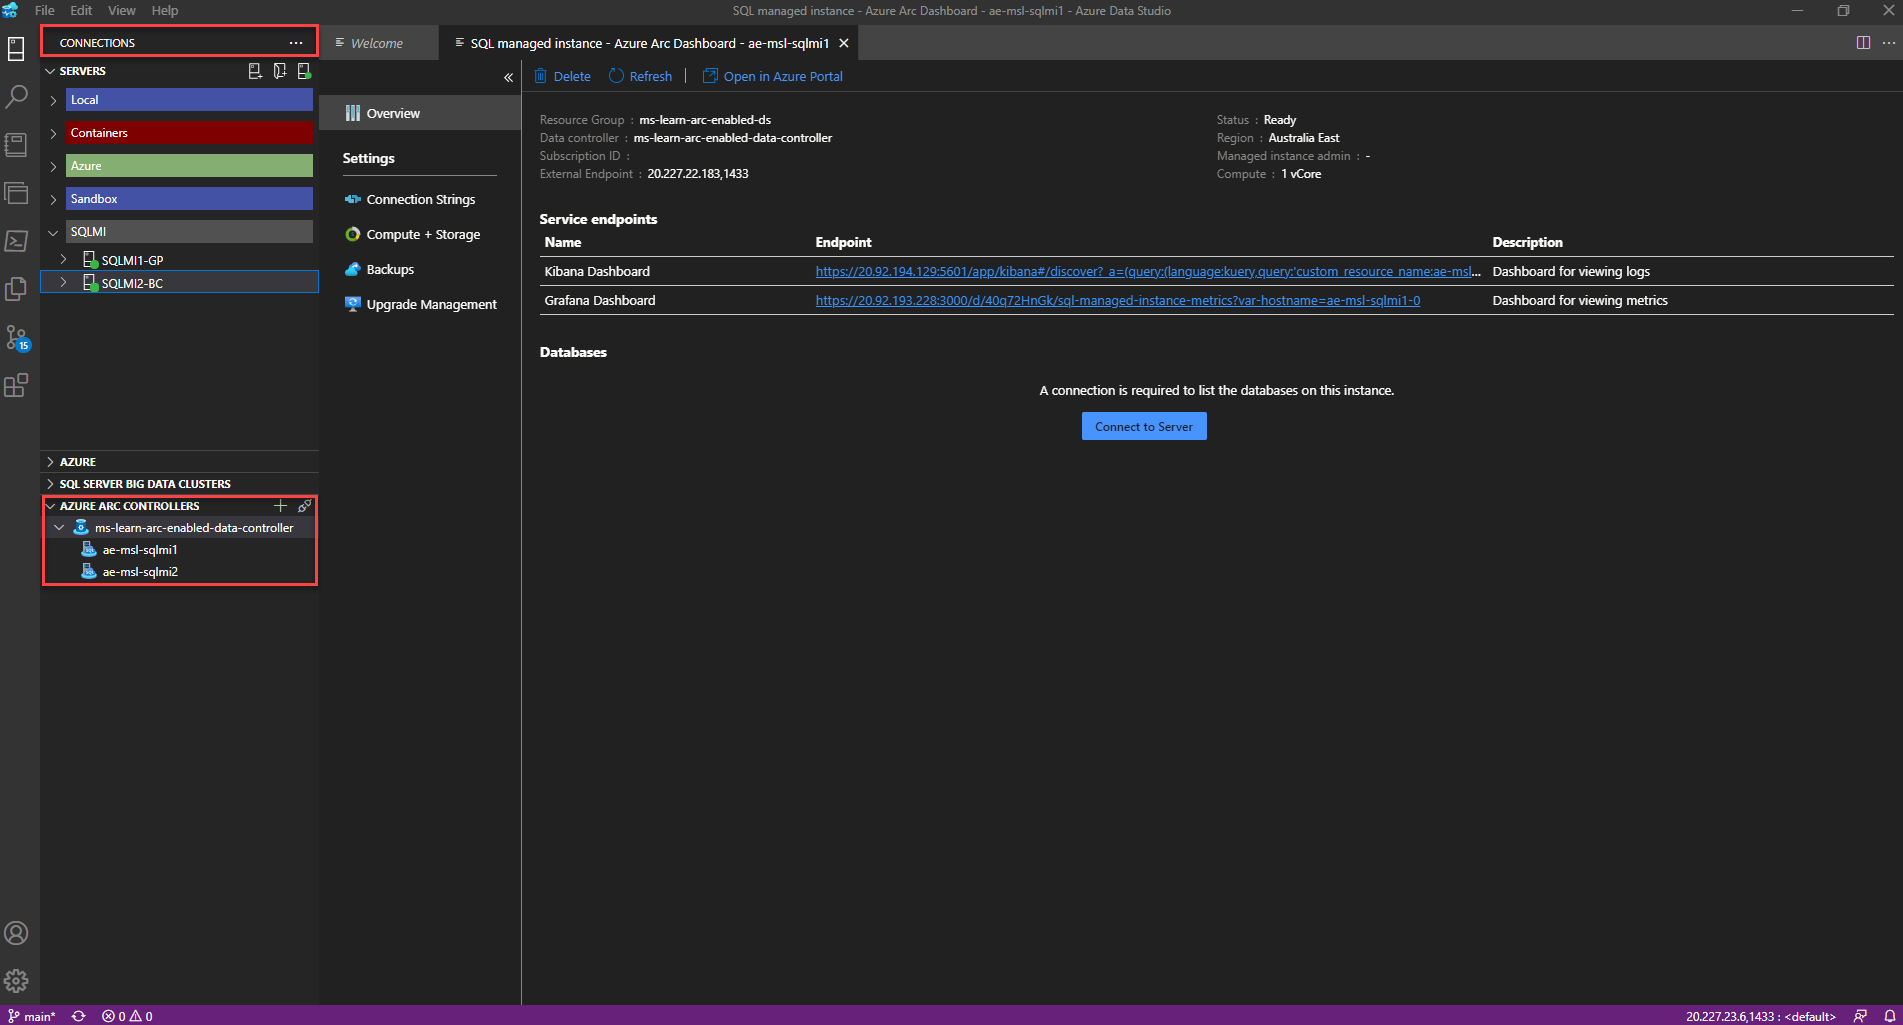
Click on Grafana Endpoint.
Enter your
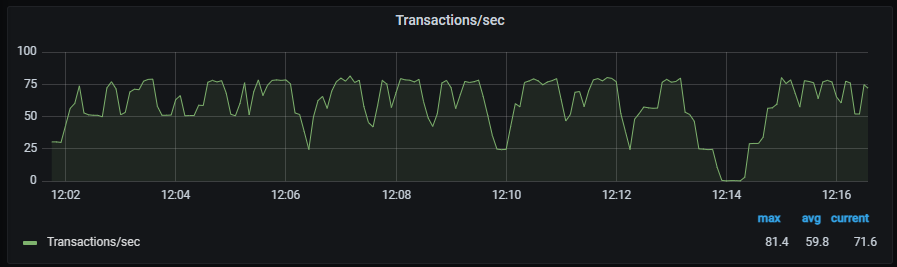
Metrics and Logs Dashboard credentialsDiscover the performance metric graphs for your Arc-enabled SQL Managed Instance:
- Transactions/sec
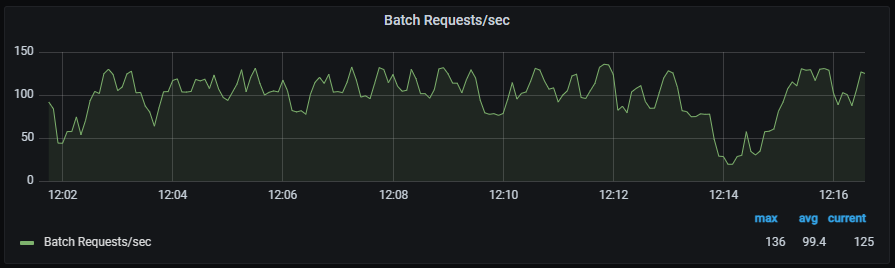
- Batch Requests/sec
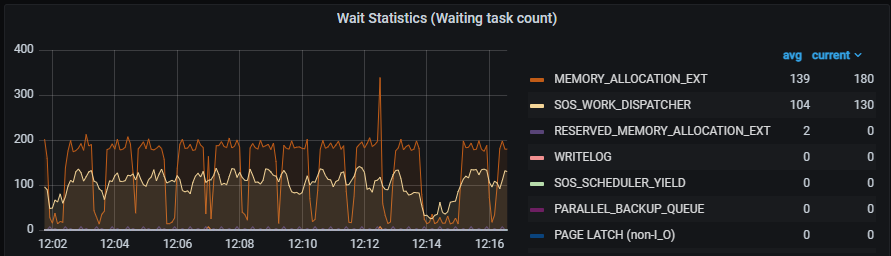
- Wait Statistics
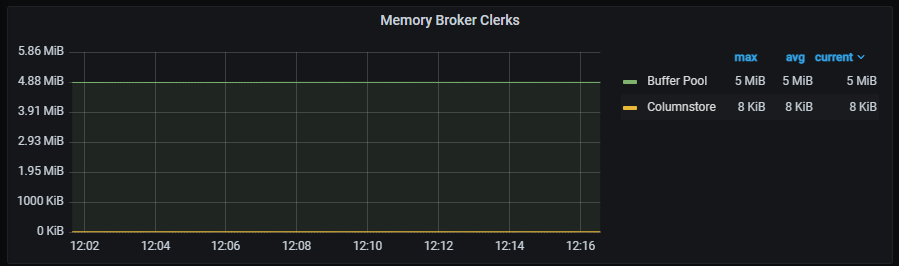
- Memory Broker Clerks
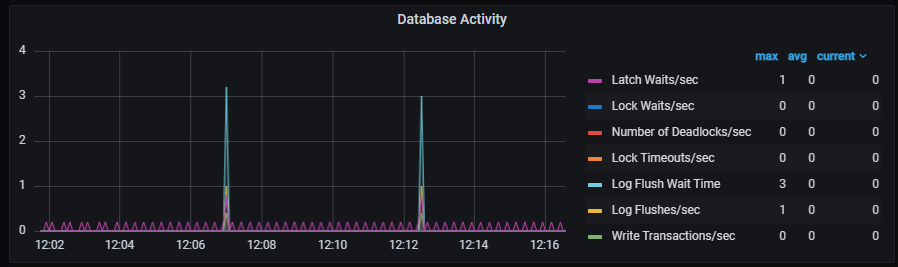
- Database Activity
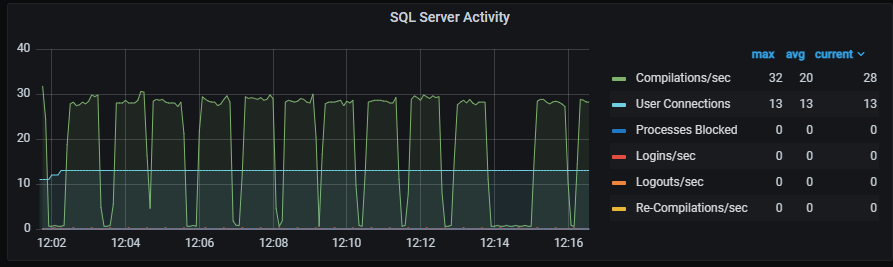
- SQL Server Activity
- Buffer Cache - Memory
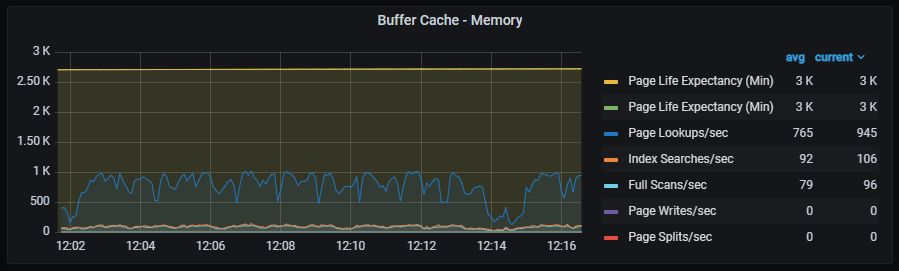
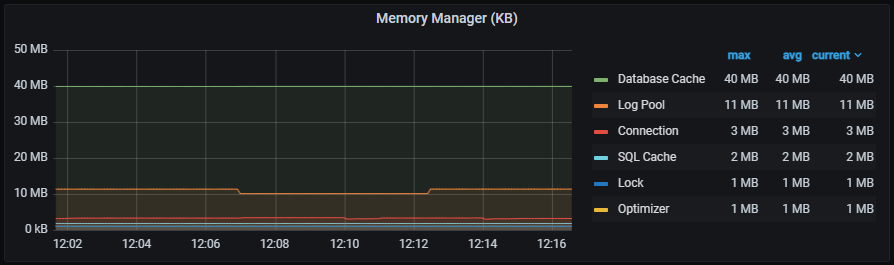
- Memory Manager
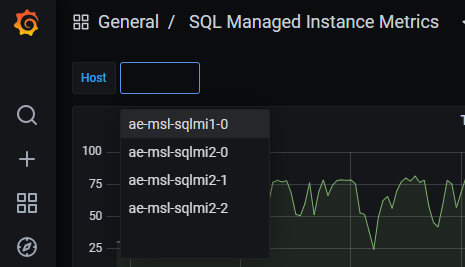
Swap to another deployed Arc-enabled SQL Managed Instance. Select the drop-down for Host.
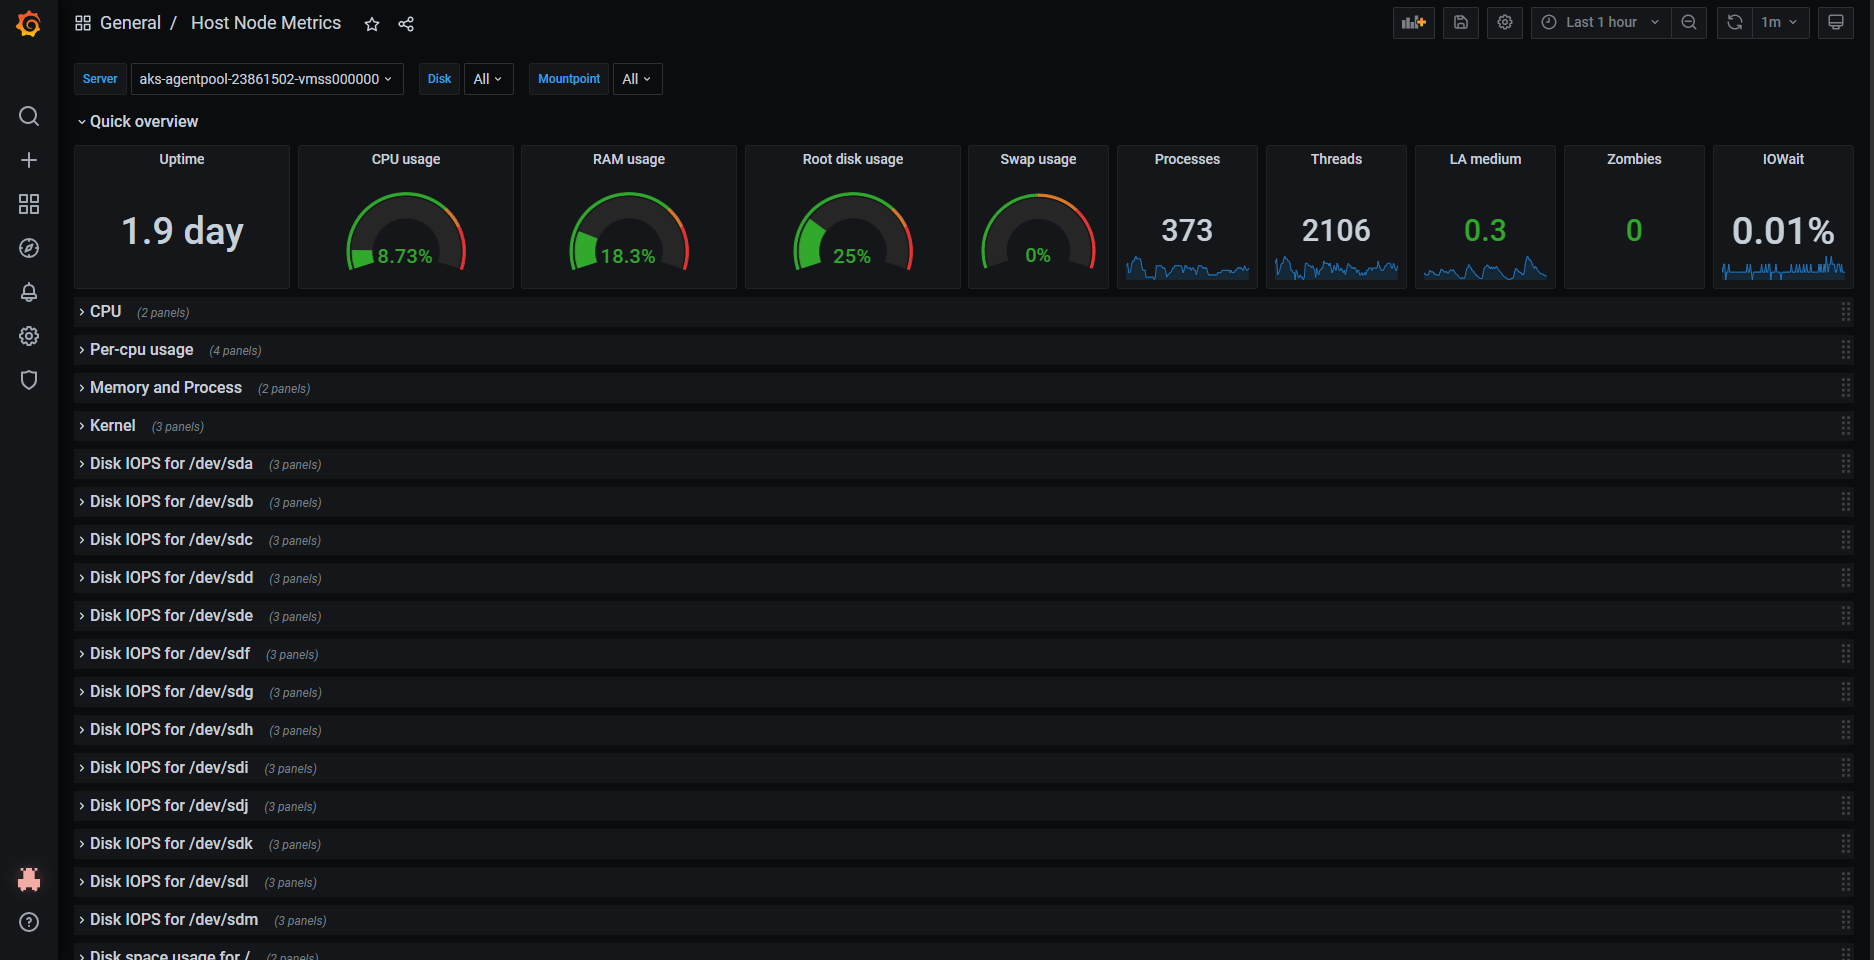
Investigate the Kubernetes Host Node Metrics.
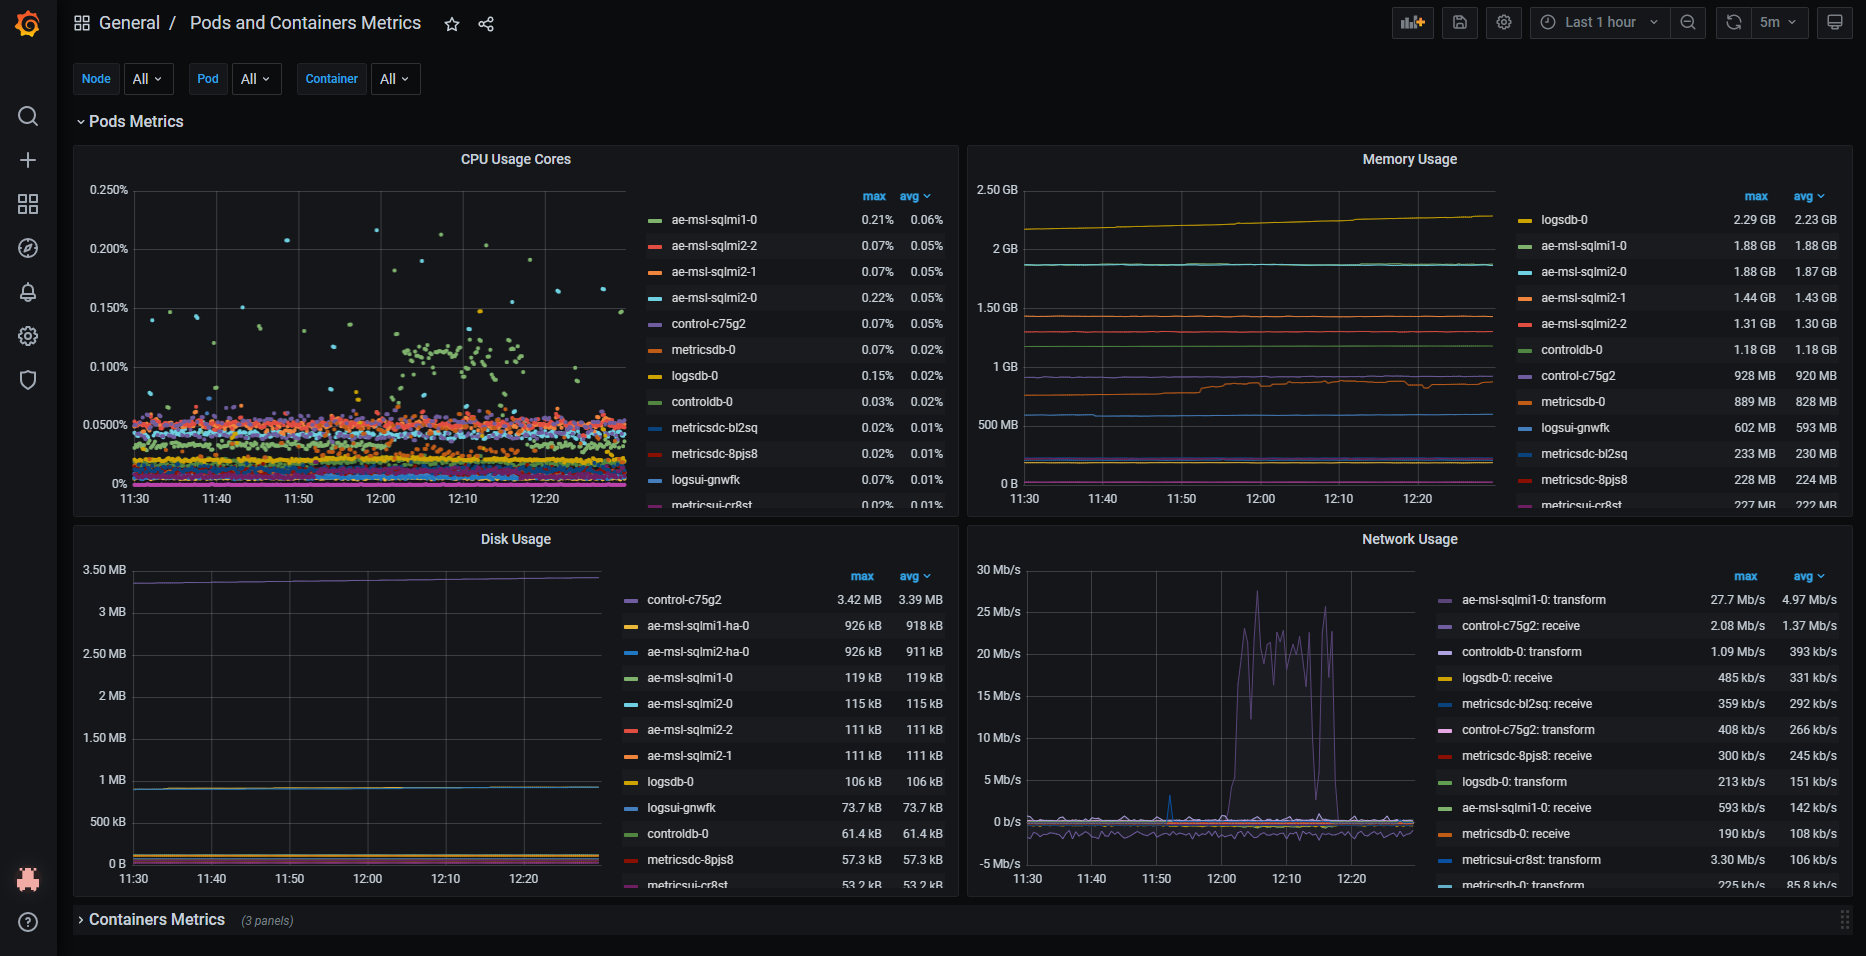
Investigate the Kubernetes Pods and Containers Metrics