Exercise - Set up your environment
In this exercise, you set up a preconfigured environment with a Load Balancer, and create charts to monitor the health of the Load Balancer.
This exercise is optional. To complete it, you need access to an Azure subscription where you can create Azure resources. If you don't have an Azure subscription, create a free account before you begin.
Set up your environment
Sign in to the Azure portal.
Select Cloud Shell from the menu bar in the upper right.
Select Bash.
Run the following command to download the scripts you use for this exercise.
git clone https://github.com/MicrosoftDocs/mslearn-troubleshoot-inbound-network-connectivity-azure-load-balancer load-balancerGo to the load-balancer/src/scripts folder.
cd ~/load-balancer/src/scriptsRun the following command to set the user name for the VMs. You can change the user name to something different. You need the user name later in this exercise, so make a note of what you use.
export USERNAME=azureuserRun the following command to create a password for the virtual machines created by the scripts. The password is stored in a variable and also recorded in the text file passwd.txt in case you need it later.
export PASSWORD=$(openssl rand -base64 32)
echo $PASSWORD > passwd.txt
Set the resource group name.
export RESOURCEGROUP=learn-ts-loadbalancer-rgSet the location. Replace the eastus value with a location near you.
export LOCATION=eastusThe following list has some location values you can use:
- westus2
- southcentralus
- centralus
- eastus
- westeurope
- southeastasia
- japaneast
- brazilsouth
- australiasoutheast
- centralindia
Run the following command to create a resource group.
az group create --name $RESOURCEGROUP --location $LOCATIONRun the following command to create the load balancer, virtual machines, and virtual network.
bash setup.sh $RESOURCEGROUPThis script takes up to 25 minutes to run.
Check resources created
In the Azure portal, search for Resource groups.
Select learn-ts-loadbalancer-rg.
Sort the list of resources by Type.
The resource group should contain the resources shown in this table.
Name Type Description retailappvm1_disk1_xxx and retailappvm1_disk2_xxx Disk Virtual hard disks for the two VMs. retailapplb Load balancer Load balancer for the app running on the VMs. The back-end pool in the load balancer references the retailappvm1 and retailappvm2 virtual machines. nicvm1 and nicvm2 Network interface Network interfaces for the two VMs. retailappnicvm1nsg, and retailappnicvm2nsg Network security group (NSG) NSGs that control the traffic entering each VM. retailappnsg Network security group Acts as an initial filter for both virtual machines, but the NSG for each virtual machine allows filtering of traffic on a per-machine basis. retailappip Public IP address Public IP address that provides front-end access to the load balancer. retailappvm1 and retailappvm2 Virtual machine VMs running the retail application. retailappvmjumpbox Virtual machine VM that is also in the virtual network but has a public IP address. An administrator can sign in to this virtual machine to access the retailappvm1 and retailappvm2 VMs, which only have private IP addresses. retailappvnet Virtual network Virtual network for the VMs. Select the retailapplb load balancer.
Under Settings, select Load balancing rules.
Select retailapprule. The load balancer is configured to route traffic that arrives on port 80 at the front-end address to port 80 on machines in the back-end pool.
Close the retailapprule pane.
Under Settings, select Health probes.
Select retailapphealthprobe. The health probe for the back-end pool also sends messages to port 80 to check that the application is available on each virtual machine.
Close the retailapphealthprobe pane.
Test the load balancer
Return to Azure Cloud Shell.
Run the following command to find the public IP address of the load balancer front end.
bash findip.shOpen a browser window, and go to this IP address. The result should be a page with the message retailappvm1 or retailappvm2, depending on how the load balancer routed the request.
In Cloud Shell, run the following command to go to the src/stresstest folder.
cd ~/load-balancer/src/stresstestThis folder contains a .NET Core application that simulates hundreds of concurrent users sending requests through Load Balancer to the virtual machines.
Run the following command to start the application. Replace <ip address> with the front-end IP address of the load balancer.
dotnet run <ip address>The application should respond with a series of messages that indicate whether a response was received from retailappvm1 or retailappvm2.
Allow the application to run for five minutes. Press Enter to stop the application.
Create charts to monitor metrics
In the Azure portal, go to the resource group learn-ts-loadbalancer-rg.
Select the retailapplb load balancer.
Under Monitoring, select Metrics.
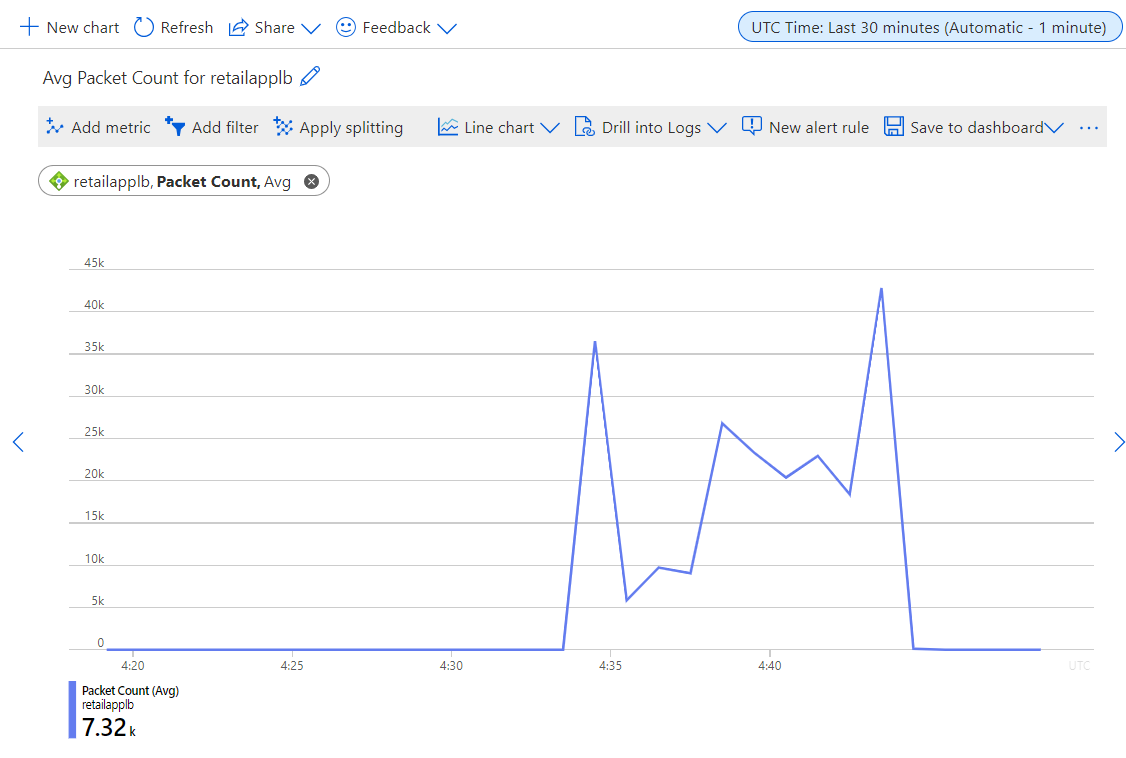
Add the following metric to the empty chart.
Property Value Scope retailapplb Metric Namespace Load balancer standard metrics Metric Packet Count Aggregation Avg At the top of the page, set the time range to Last 30 minutes. The chart should look similar to the one shown here. Note the peak value of the average packet count.
Select Pin to dashboard.
Select Create new, and enter the following values.
Field Value Type Private Dashboard name dashboard-learn-ts-loadbalancer Select Create and pin.
Select New Chart, and add the following metric.
Property Value Scope retailapplb Metric Namespace Load balancer standard metrics Metric Health Probe Status Aggregation Avg Select Add metric, and add another metric to the chart by entering the following values.
Property Value Scope retailapplb Metric Namespace Load balancer standard metrics Metric Data Path Availability Aggregation Avg Set the time range to Last 30 minutes. The chart should report both statistics at 100 percent.
Select Pin to dashboard > Existing.
For a dashboard, select dashboard-learn-ts-loadbalancer.
Select Pin.
You now have a baseline set of metrics for the system when it's running correctly.