Troubleshooting Windows Containers with Azure Monitor
Azure Monitor is a cloud-based monitoring and analytics service provided by Microsoft Azure that helps organizations to gain visibility into the performance, availability, and usage of their applications and infrastructure hosted on the Azure platform. With Azure Monitor, users can collect and analyze telemetry data from various sources such as logs, metrics, and traces to gain insights into the health of their resources, detect and diagnose issues, and optimize their applications for better performance and efficiency. Azure Monitor also provides tools for creating and configuring alerts, dashboards, and reports to help users quickly identify and respond to issues in real-time.
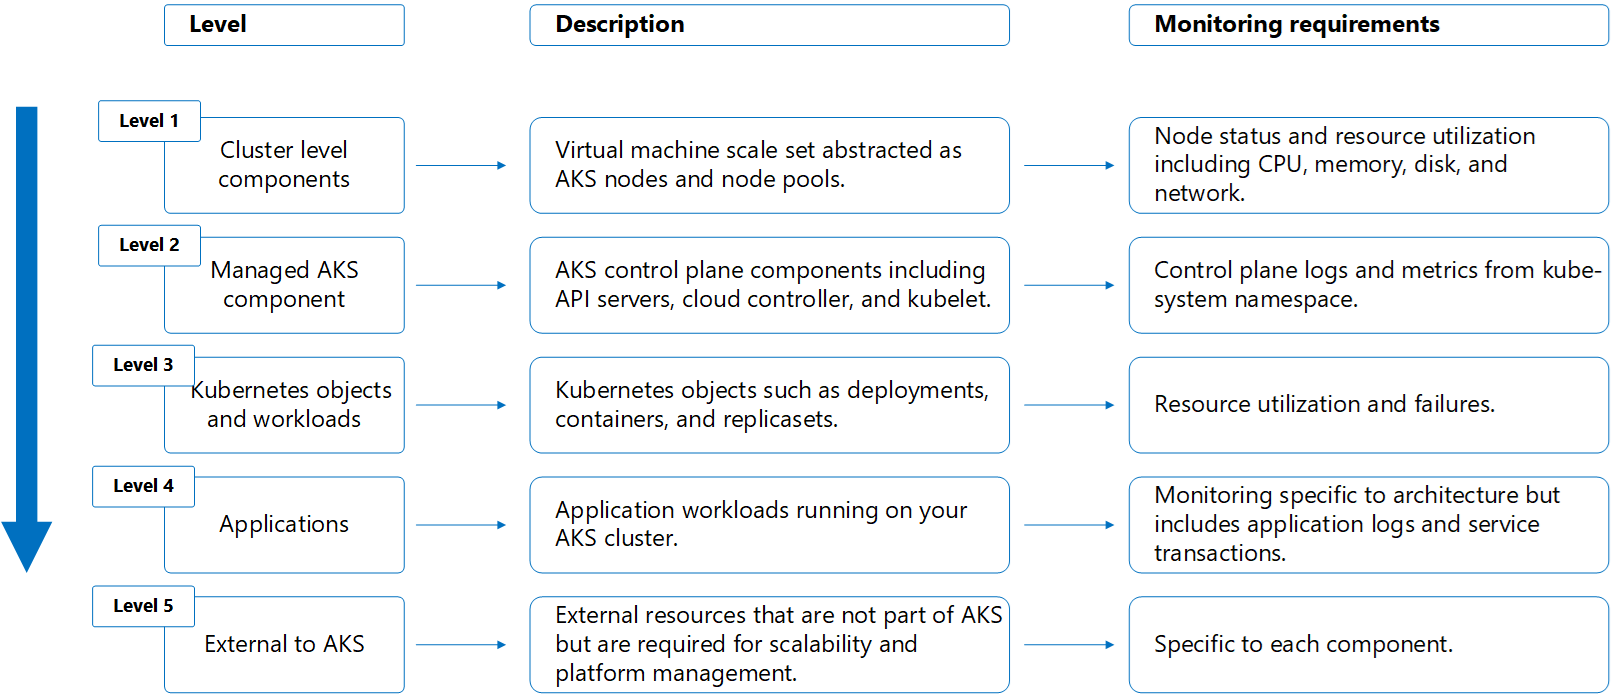
First, we need to understand what type of logs, metrics does AKS generate. These can be structured as layers.
Out of the box, AKS offers some basic monitoring (cpu, disk, memory) around nodes, but it's not very useful to understand possible issues in your cluster or applications. To have visibility across containerized application, cluster health, audit logs, etc. setting up Container insights is recommended.
Below are some of the components of an Azure Monitor solution that help you troubleshoot your environment.
Container insights
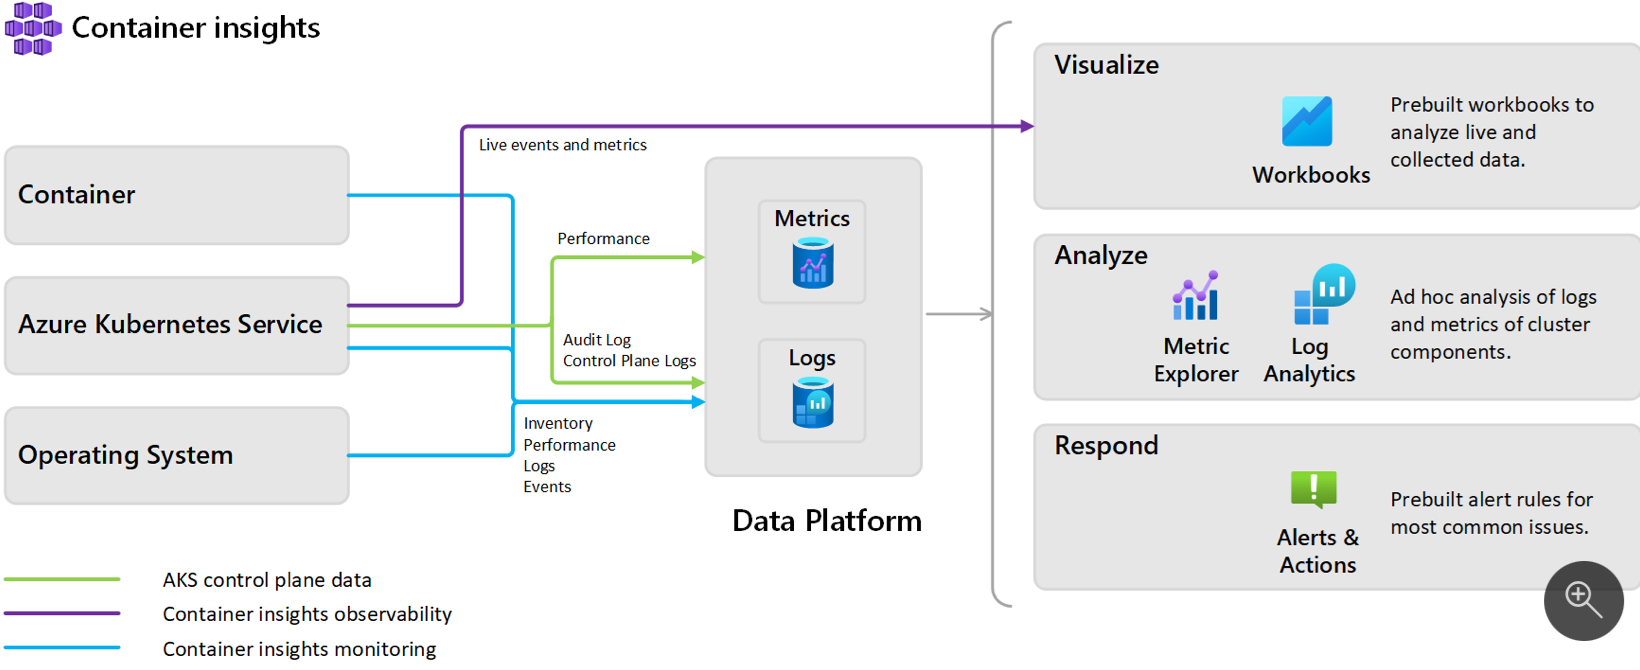
Container insights is a feature designed to monitor the performance of container workloads deployed to the cloud. It gives you performance visibility by collecting memory and processor metrics from controllers, nodes, and containers that are available in Kubernetes through the Metrics API. After you enable monitoring from Kubernetes clusters, metrics and Container logs are automatically collected for you through a containerized version of the Log Analytics agent. Below you can see a high-level overview of the Container Insights architecture.
Enabling Container Insights requires having a Log Analytics workspace and an Azure Monitoring workspace with an Azure Managed Grafana.
Log Analytics workspace
Log Analytics workspace is a unique environment for log data from Azure Monitor and other Azure services, has its own data repository and configuration but might combine data from multiple services including AKS. You can either create your own, or let Azure create a default one for you. It's used to store all logs generated by your AKS cluster.
Make sure you enable LogMonitor for your Windows containers so the Log Analytics agent can collect them from STDOUT.
Azure Monitoring workspace
Azure Monitoring workspace is a unique environment for Prometheus metrics. This workspace will be used to store your AKS metrics.
Azure managed Grafana
This is a managed Grafana instance to visualize the metrics stored in the Azure Monitoring workspace, you can also bring your own Grafana instance.
Use Azure Monitor to debug containers
Azure Monitor can easily identify issues at all levels inside your AKS cluster. We'll go through them below.
The debugging process can be split in two: application/container issues, or cluster problems.
Let's go over troubleshooting the application/container first:
Container
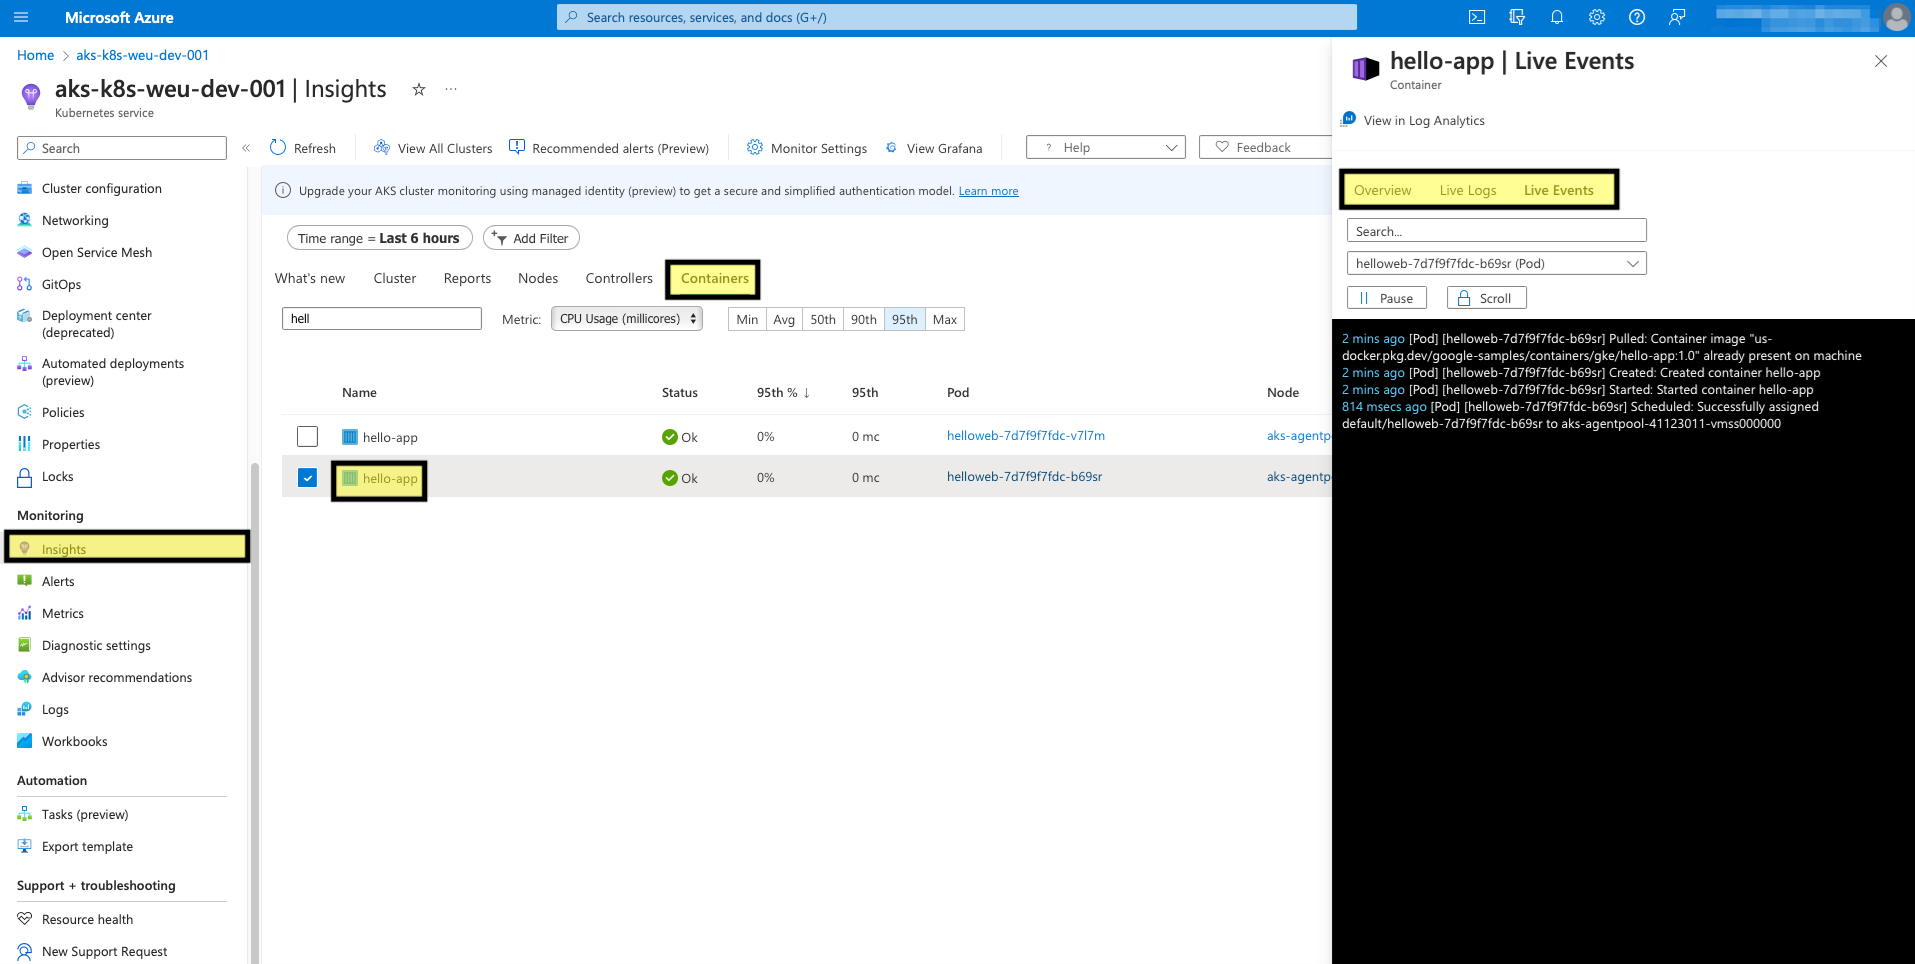
One way you can check your running container, is by going to the insights tab on the left side blade, Containers view and selecting your container. By doing this, you gain quick information over the container, its logs and events. For example, if you enabled Log Monitor on an IIS instance running on AKS, you can see the IIS events directly on the Azure portal.
Control plane
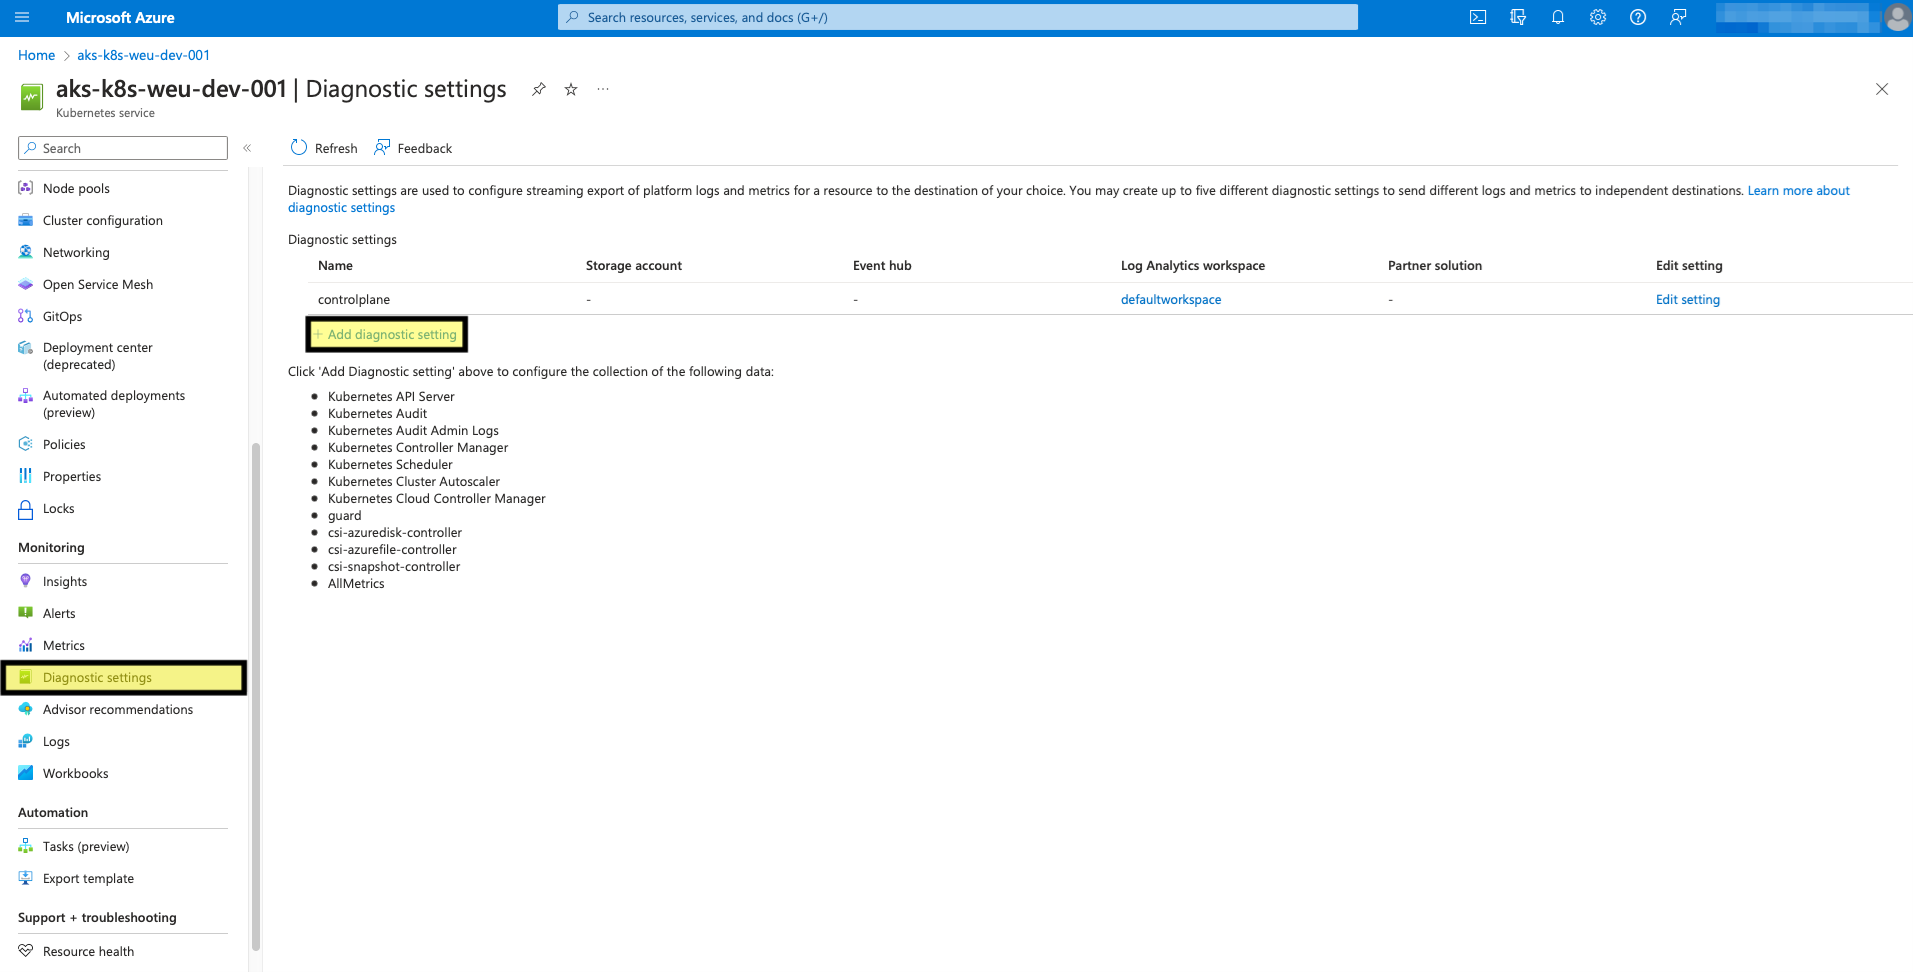
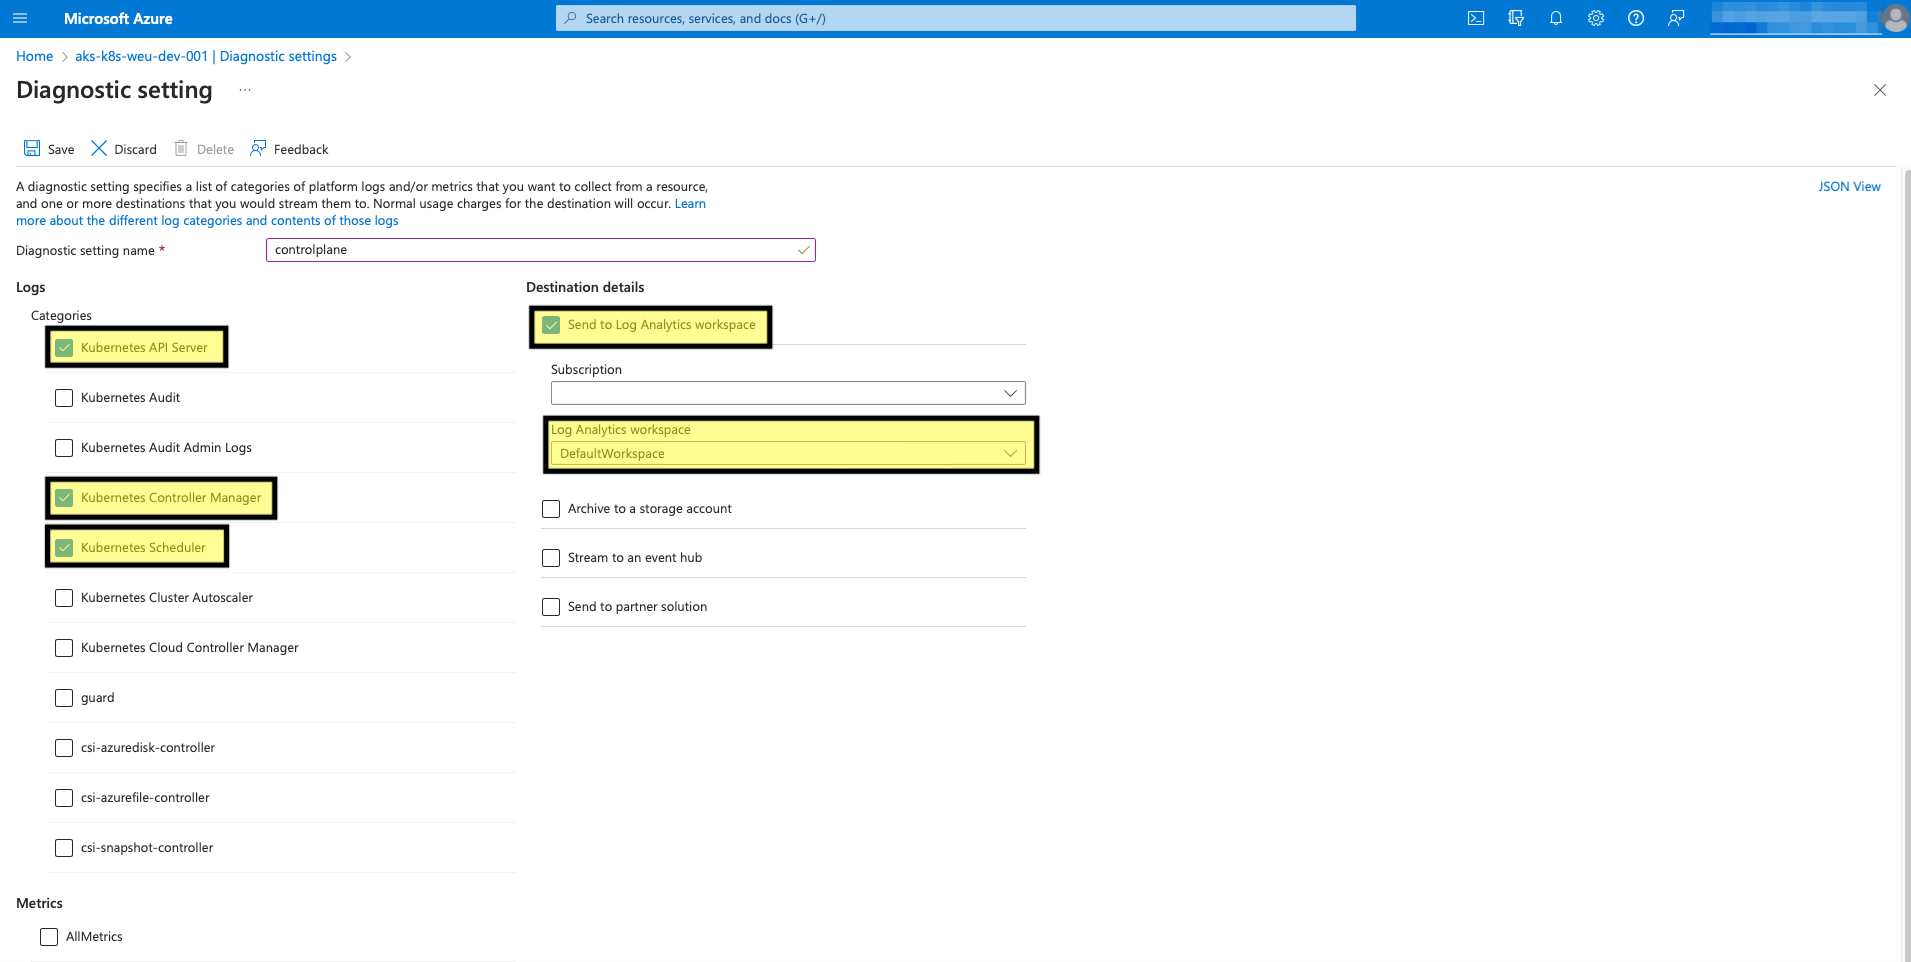
To get the logs from the control plane components, you need to enable Diagnostic Settings, as in the image below:
Highlighted below are the most important control plane components. Make sure you select to push to the Log Analytics Workspace and select the desired one.
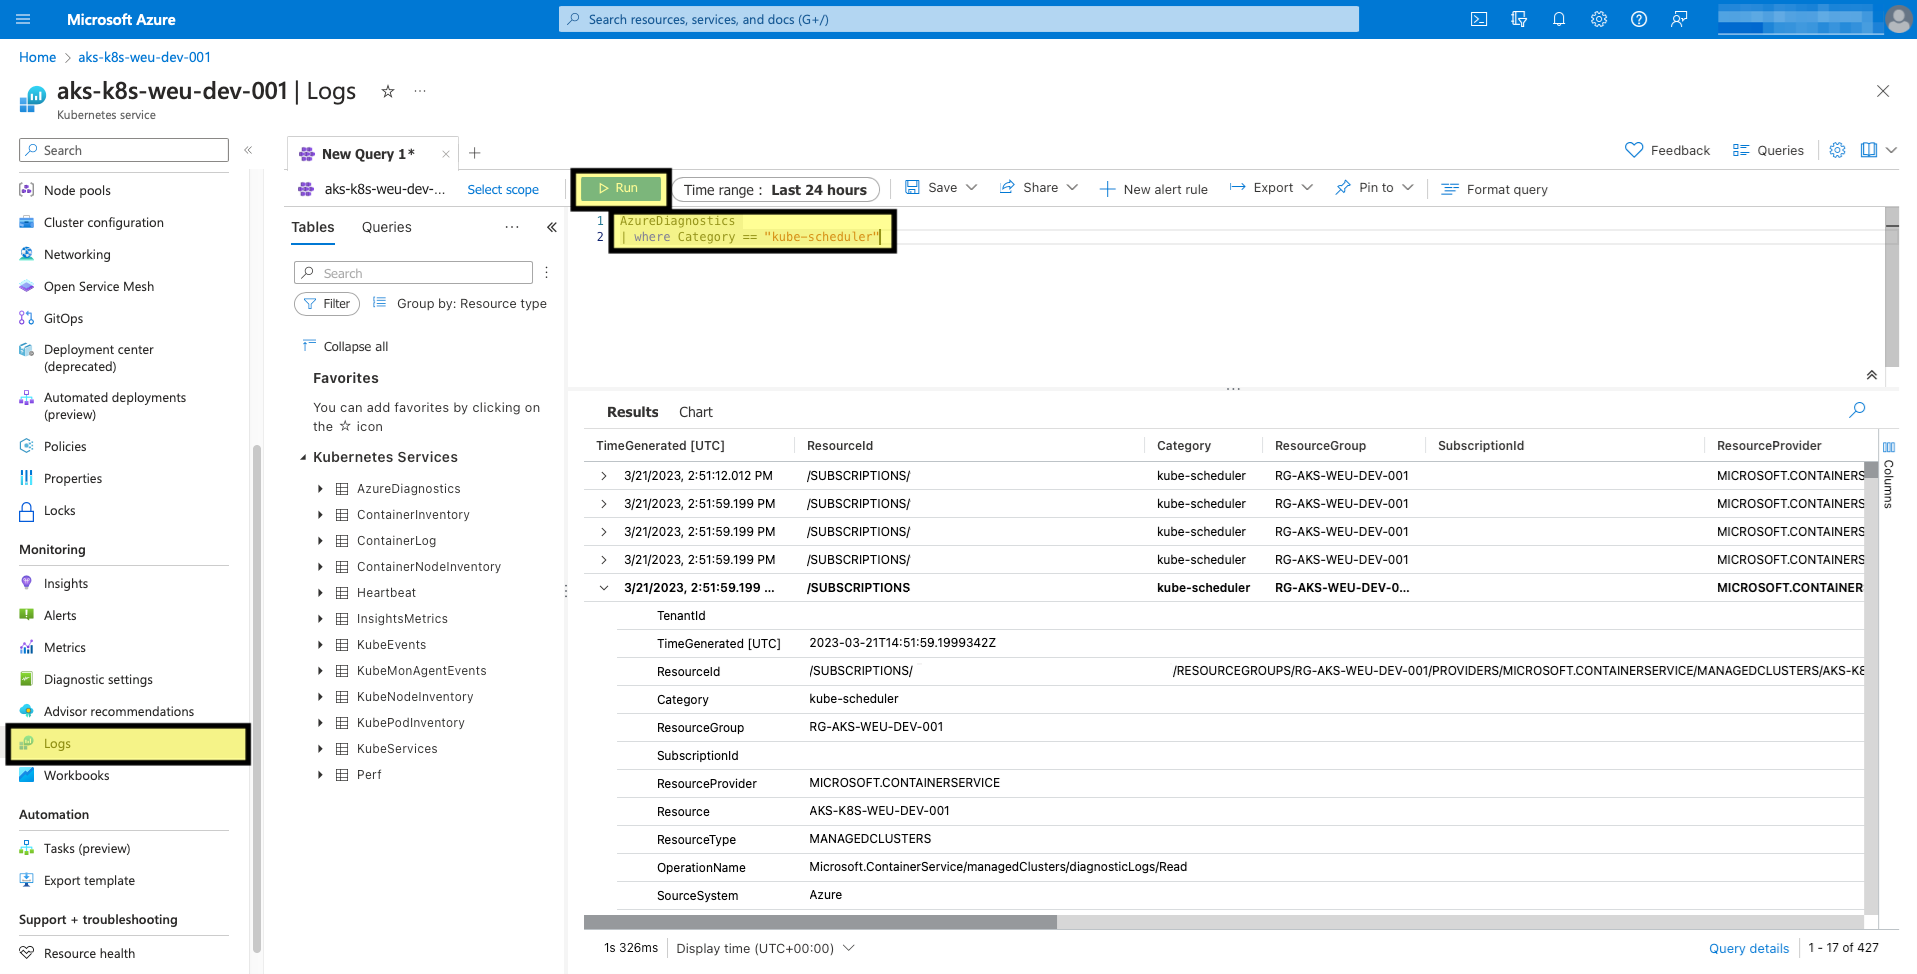
After this, you can query the logs in the Logs view:
Windows Exporter on Azure Kubernetes Service
Another option to monitor your Windows AKS nodes is by using the windows-exporter. This is the Windows variant of the Prometheus node-exporter. You can directly apply it in your cluster with a YAML specification. Take note that it will run as Host Process Container, the Windows variant of privileged containers, and because of that it can query host services, metrics, etc.
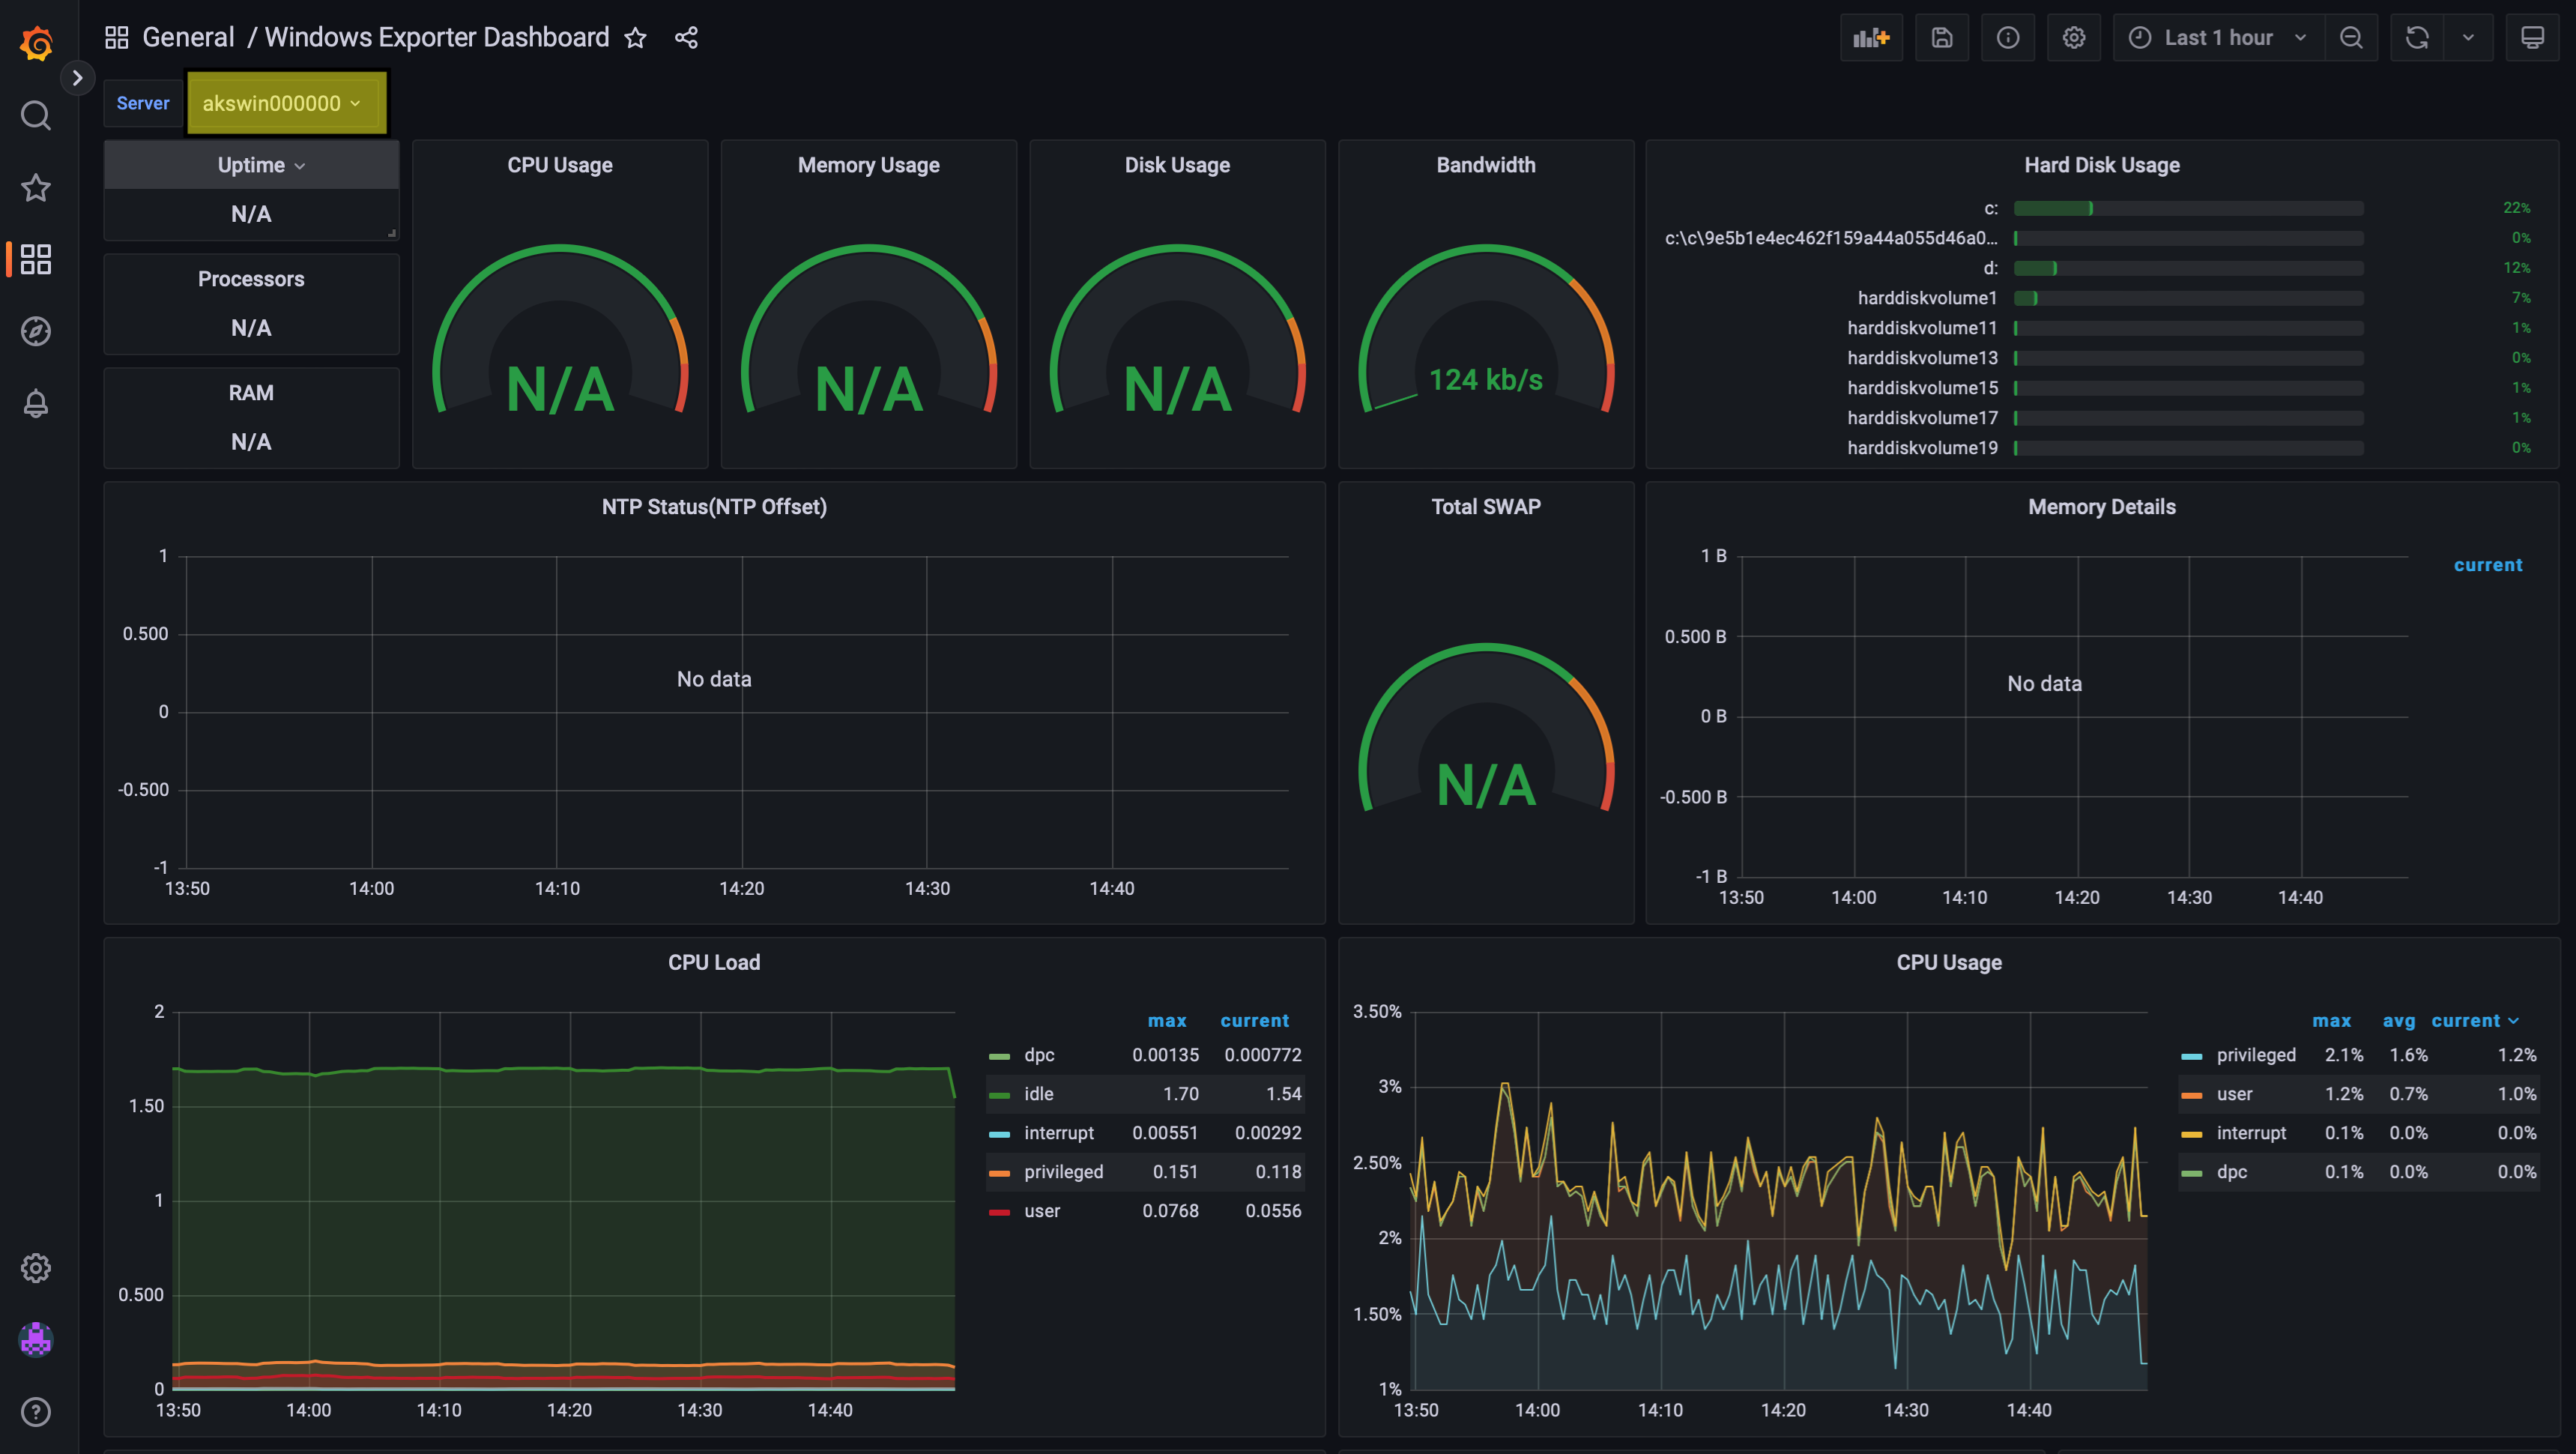
Once you have Prometheus configured and Windows-exporter enabled, the Windows node related data should be in your Azure Monitor Workspace. You can use a Grafana dashboard to see the relevant metrics you enabled for your Windows node:
