Explore the data analytics process
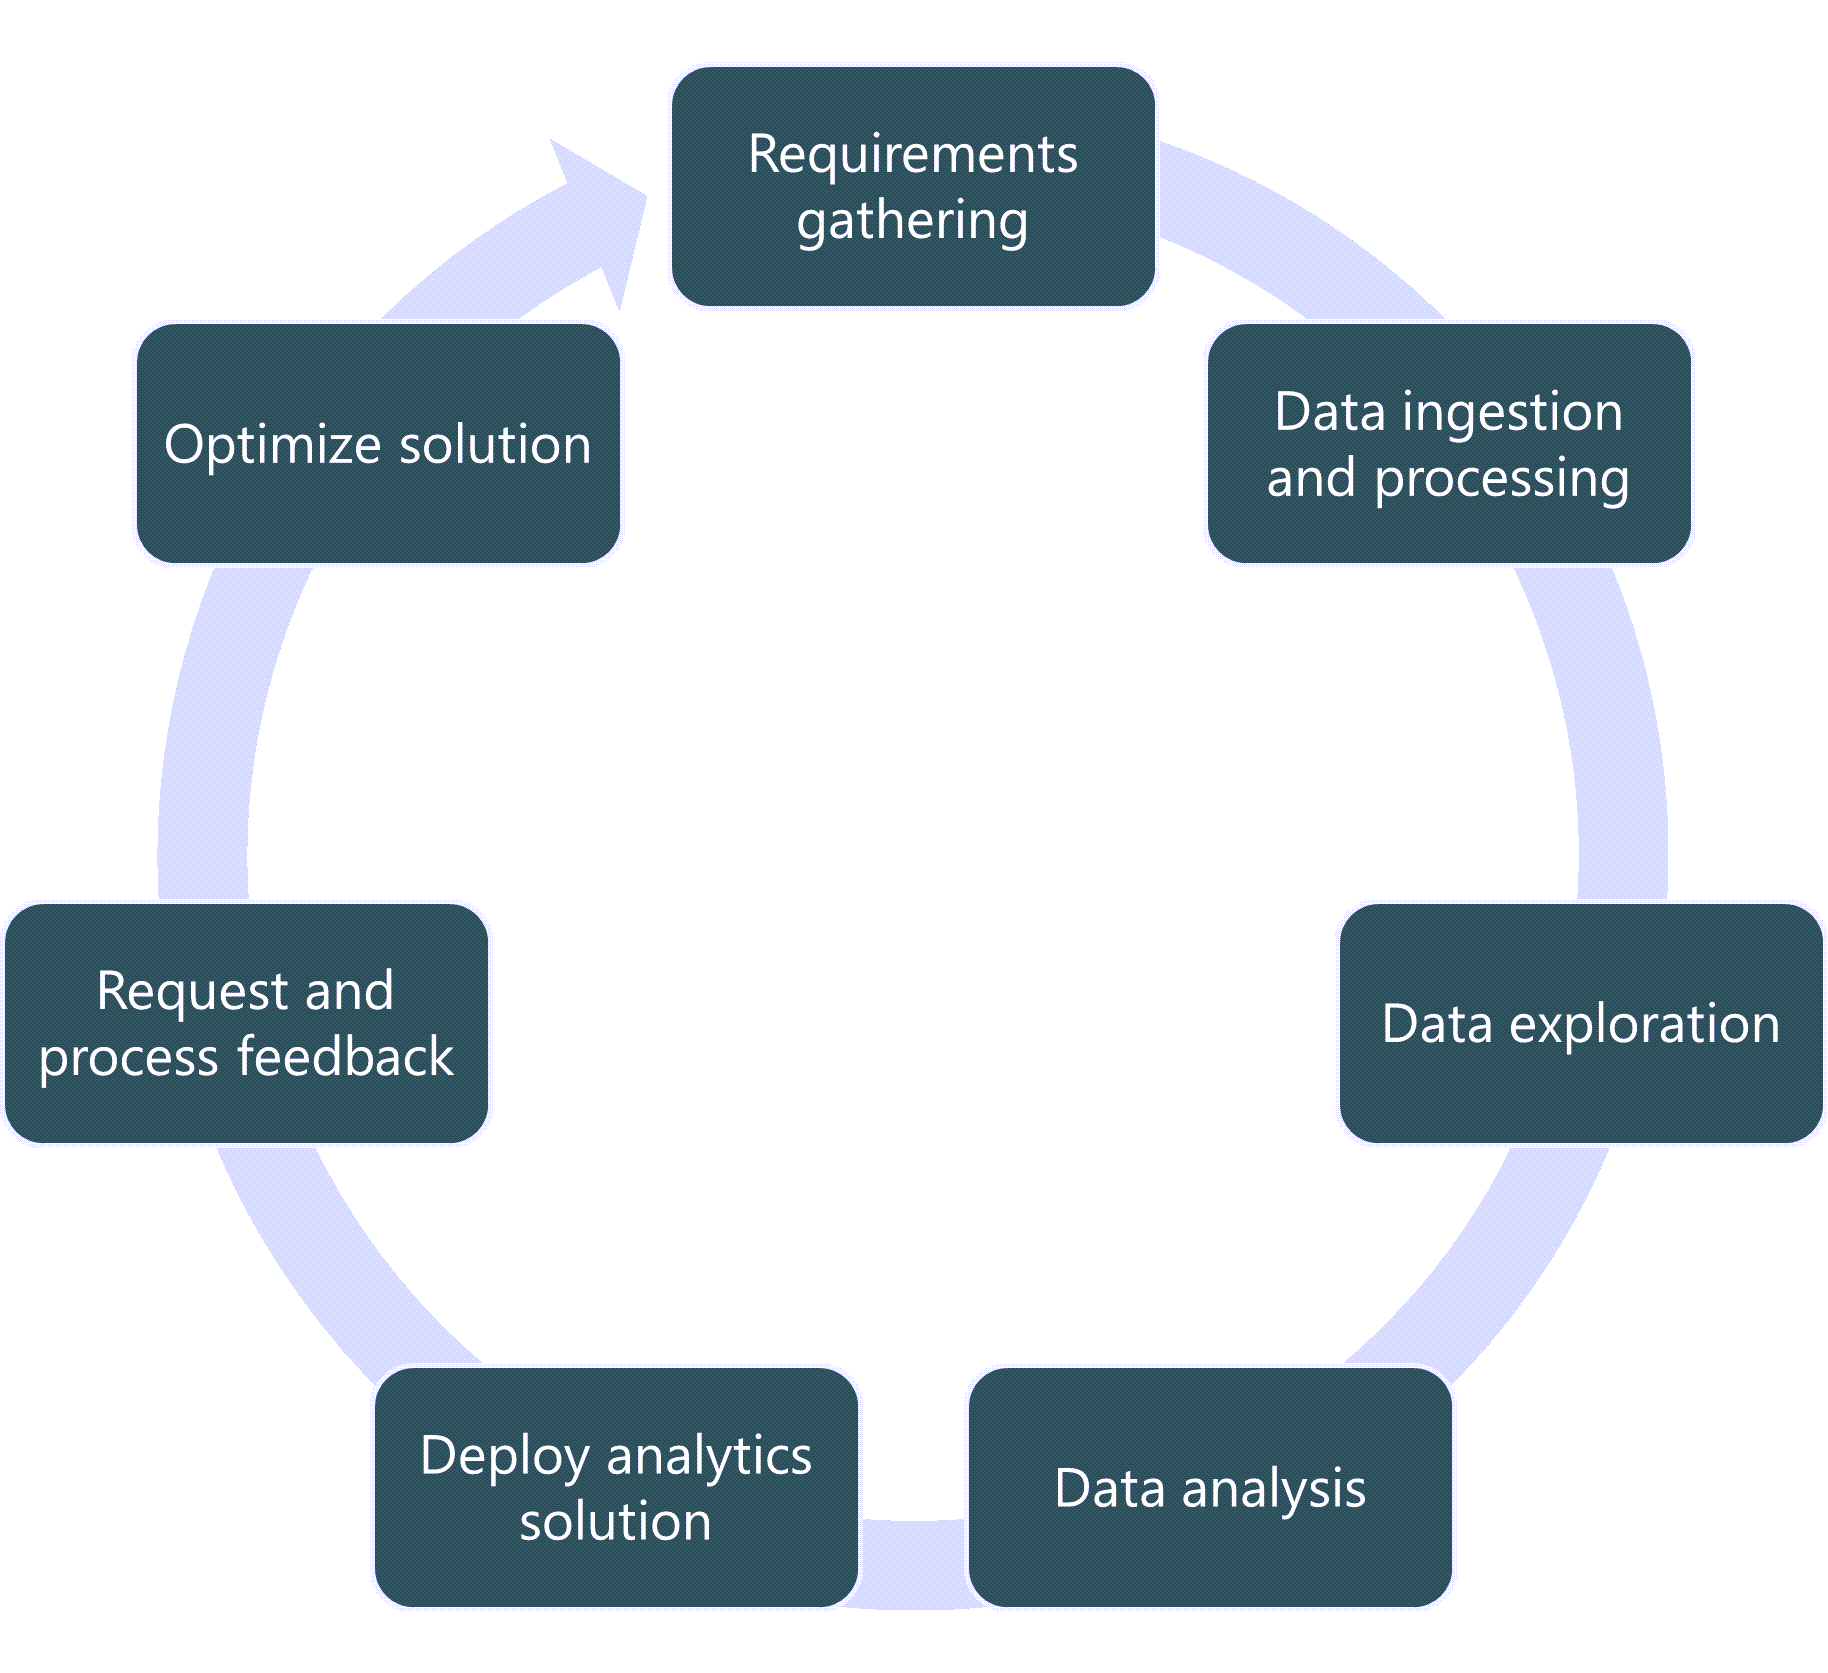
Data analytics is the process of collecting, transforming, and presenting data to inform decision making. Developing an analytics solution begins before any technology is involved, with a requirements gathering exercise. From there the process continues to ingesting, processing, and exploring data. Analysis and solution deployment are followed by requesting feedback from the business. Finally, the analytics solution is optimized and the process begins again. The analytics process is never done.
Here, you'll learn what steps are included in the data analytics process.
Requirements gathering
Data teams work with the business to understand business needs and intended outcomes of an analytics project. Requirements gathering includes identification of:
- What are the key business questions?
- What data are available? Will available data respond to business needs or does more data need to be collected?
- What are the essential dimensions - how will stakeholders want to slice and dice the data?
- What are the key performance indicators or performance metrics?
- How will users consume the analysis?
- What is the frequency of data ingestion?
- What is the frequency of reporting?
It's a common misunderstanding that a data team will be able to extract insights from volumes of data without having discussed any of the questions above. A data team won't be able to determine the appropriate type of analysis and/or the correct solution without having followed a structured requirements gathering process.
Requirements gathering may take many forms depending on team structure, data volume and velocity, and the type of analysis required.
Data ingestion and processing
Using the requirements gathered from the business, a data team will begin to ingest and transform data.
Azure data services available for ingestion and transformation include, but aren't limited to Azure Cosmos DB, Azure SQL Database, Azure Synapse Analytics, Azure Databricks, Azure Data Lake, Azure Event Hubs, and Azure Stream Analytics.
A data engineer is often responsible for the initial ingestion and transformation of data. Data is then surfaced to other members of the data team for exploration and analysis. Azure data services commonly used by enterprise data analysts and data scientists may be limited to specific databases or data lakes.
The terms Extract, Transform, and Load (ETL) or Extract, Load, and Transform (ELT) refer to the process of ingesting and processing data.
Note
Learn more about the ETL process.
Data exploration
Data exploration is the effort to understand what you're working with, and how that data can respond to the needs of the business. Data exploration can be done in many different tools. At a basic level, the data team might use Excel to look at the contents of a .csv to view the number of records and/or the specific variables they have to explore. Each member of the data team may conduct data profiling in a different tool. An analyst may profile data using Power Query in Power BI, while a data scientist may use Apache Spark in Azure Synapse.
Data exploration helps inform required data transformation and cleaning steps, which can be communicated back upstream to the data engineer to build into the analytics solution.
The analyst may also begin dashboard or report prototyping in the data exploration phase. Understanding how the business wants to see and use the results of the analysis will inform the prototype, along with trends and or insights uncovered during data exploration.
Data analysis
After data have been explored, data analysis can begin. Analysis can be descriptive, predictive, prescriptive, or even cognitive and can be conducted in many different tools. Results should respond to identified business needs and upon initial review, will likely lead to more questions and analysis.
There is a difference between a one-off analysis and an analytics solution. Both have their place, and the need for one or the other will be determined during the requirements gathering process.
Deploy analytics solution
Results will be presented to stakeholders in a reporting or data visualization tool like Microsoft Power BI, where people can interact with and use the results of the analysis for decision making.
Key considerations in the deployment of an analytics solution will help determine the right tools, licensing, and permissions needed to get data into the hands of everyone that needs it. Access to timely insights will ultimately lead to data-informed decisions.
Request and process feedback
Deployment of an analytics solution may feel like a finish line, but it's important to understand the answers to a few key questions.
- Is the data product being used?
- Does the analysis truly respond to the business needs?
- Are there any unforeseen technical issues with the solution?
- Is the data product accessible?
- What new business questions does this analysis raise?
The individuals using your analytics solution are your customers, and if the product you have built doesn't adequately respond to their needs, there's work to be done.
There are multiple mediums of soliciting feedback. The first launch of a solution may require regular review meetings, whereas monitoring usage metrics of an ongoing project will help you understand usage over time and even areas of your solution that are and aren't useful.
Optimize solution
Implementing the feedback of your users is a logical first step to optimize your analytics solution. There may also be opportunities to remove latency in the process, for example, ensuring the data refresh occurs in the allotted time. Optimization could also mean more accurately reflecting user needs by tweaking visual design or ensuring report visuals render quickly.
Begin again
The analytics process is cyclical by nature. Exposing data and insights often leads to requests for more analysis, which leads to more feedback, and so on. On a large data team, the analytics process may occur in short sprints, where different team members work simultaneously to achieve small goals before moving onto the next step in the process. On smaller teams, one person may be acting in multiple roles, which would make the process look different.
Regardless of what the process looks like for you, communication is a critical component throughout. The data team must communicate with each other and be in dialogue with the business, to ensure solution development is responding to business needs and needs that may appear in the data.