Note
Access to this page requires authorization. You can try signing in or changing directories.
Access to this page requires authorization. You can try changing directories.
This article helps you learn how to understand the costs that are associated with your Log Analytics workspace and identify the causes of expense increases.
Understand and analyze the cost reports
Note
The prices that are shown in the following images are examples only. They do not reflect actual pricing.
Sign in to the Azure Preview portal.
Important
The Azure Preview portal may include preview, beta, or other pre-release features, services, software, or regions offered by Microsoft for optional evaluation ("Previews"). Previews are licensed to you as part of your agreement governing use of Azure, and subject to terms applicable to "Previews".
Certain named Previews are subject to additional terms set forth below, if any. These Previews are made available to you pursuant to these additional terms, which supplement your agreement governing use of Azure. Capitalized terms not defined herein shall have the meaning set forth in your agreement. If you do not agree to these terms, do not use the Azure Preview portal.
Enter log analytics in the search bar.
Under Services, select Log Analytics.
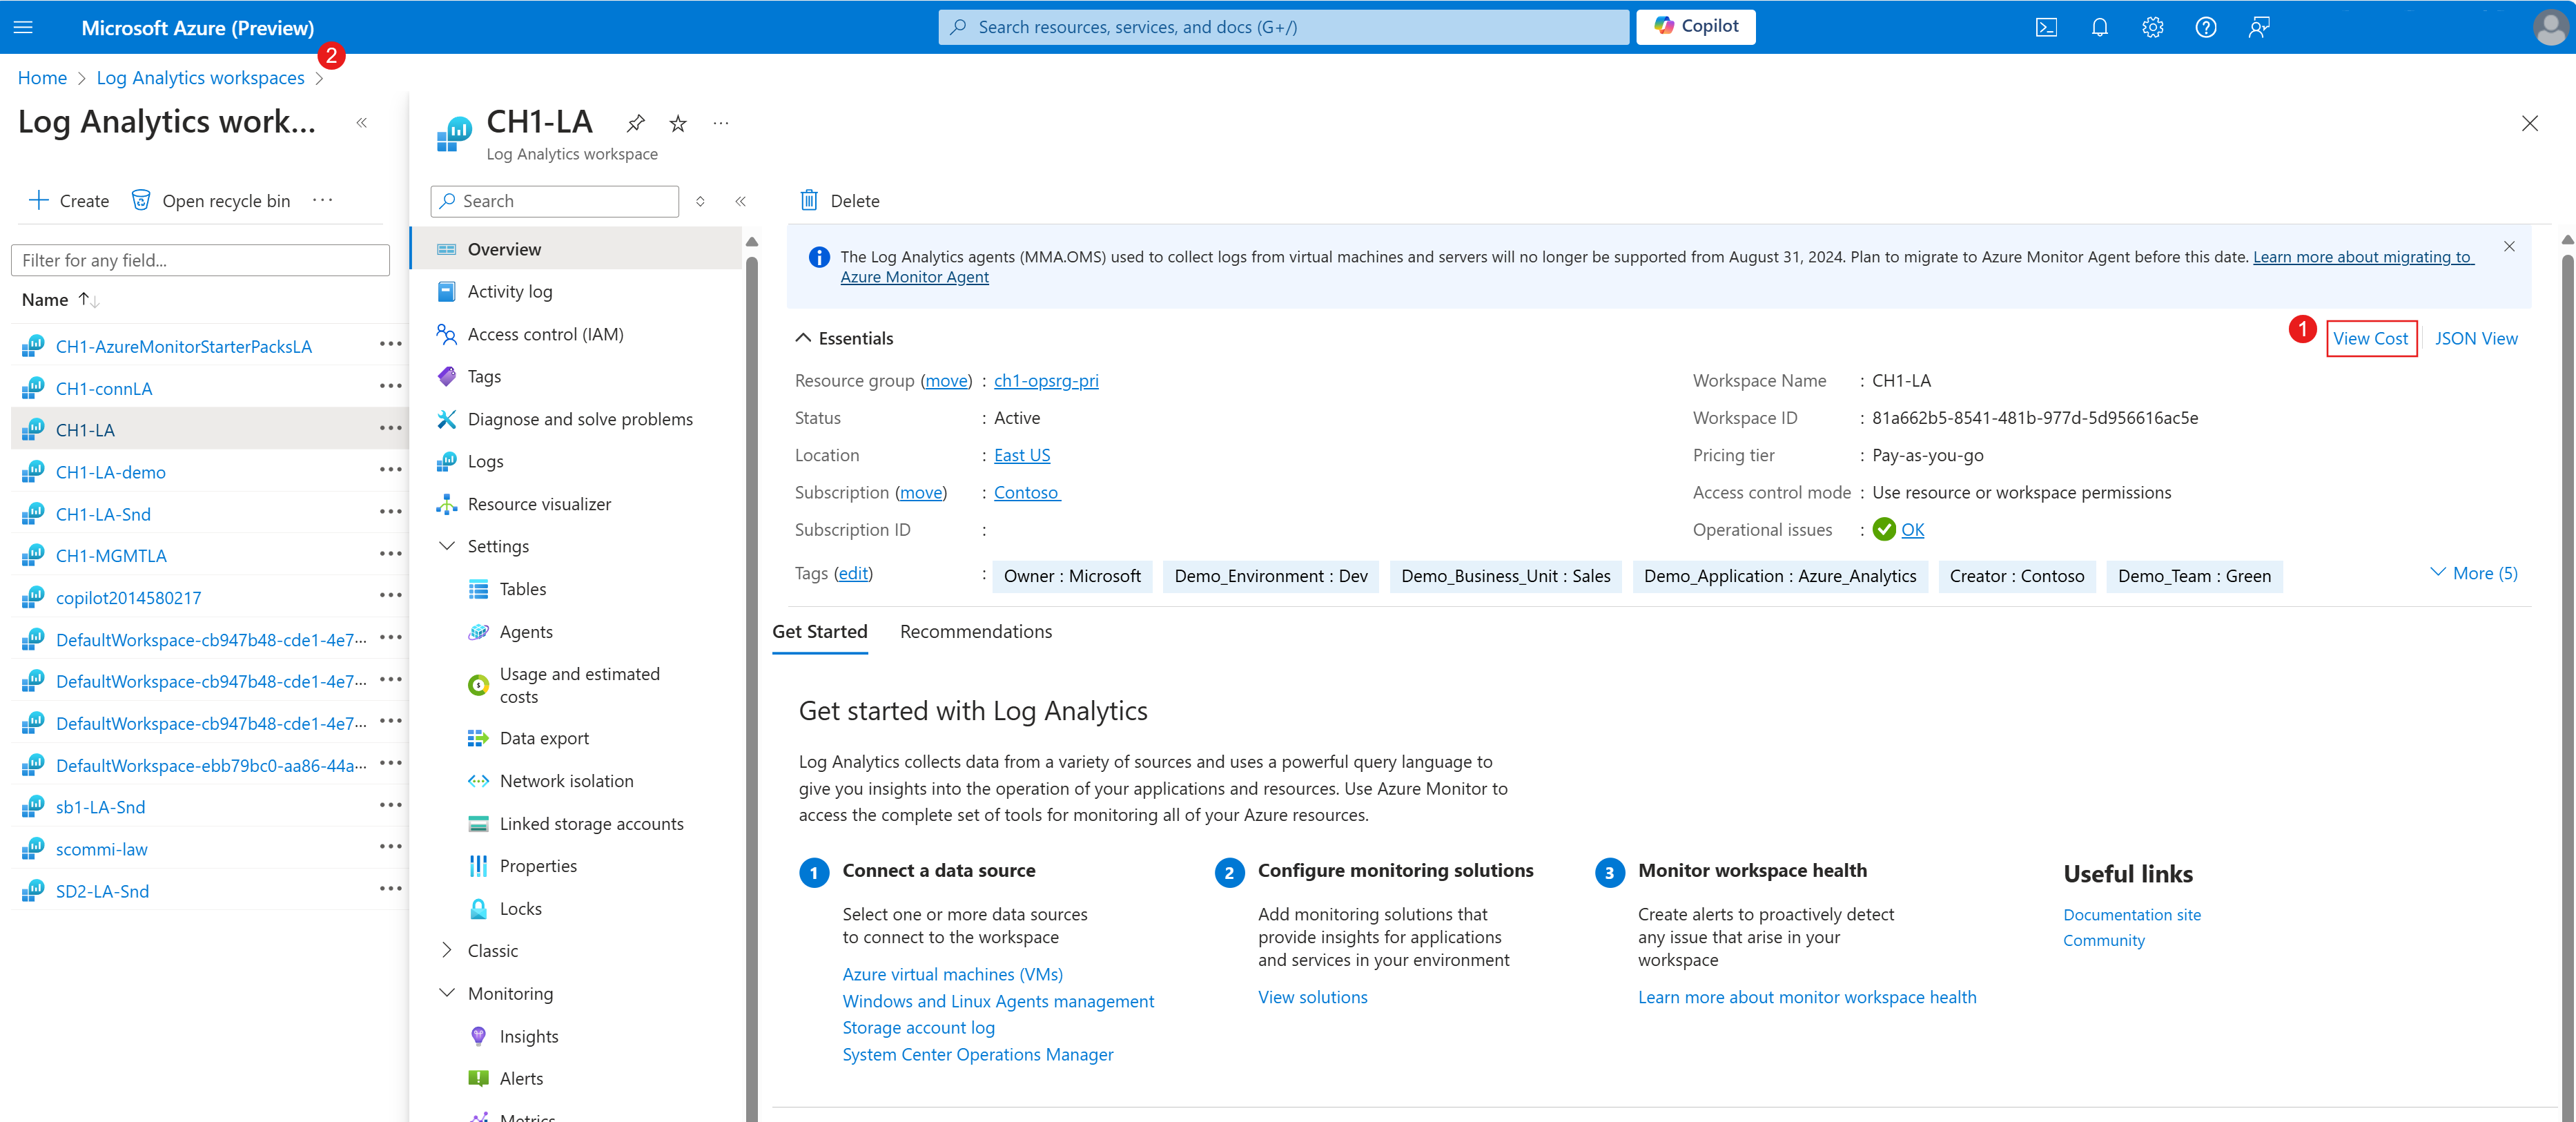
Select the Log Analytics workspace that you want to investigate.

On the Overview page, select View Cost (1) to open the Cost analysis page for the current log analytics service. If you don't see View Cost, ensure that you are using the Azure Preview portal(2).
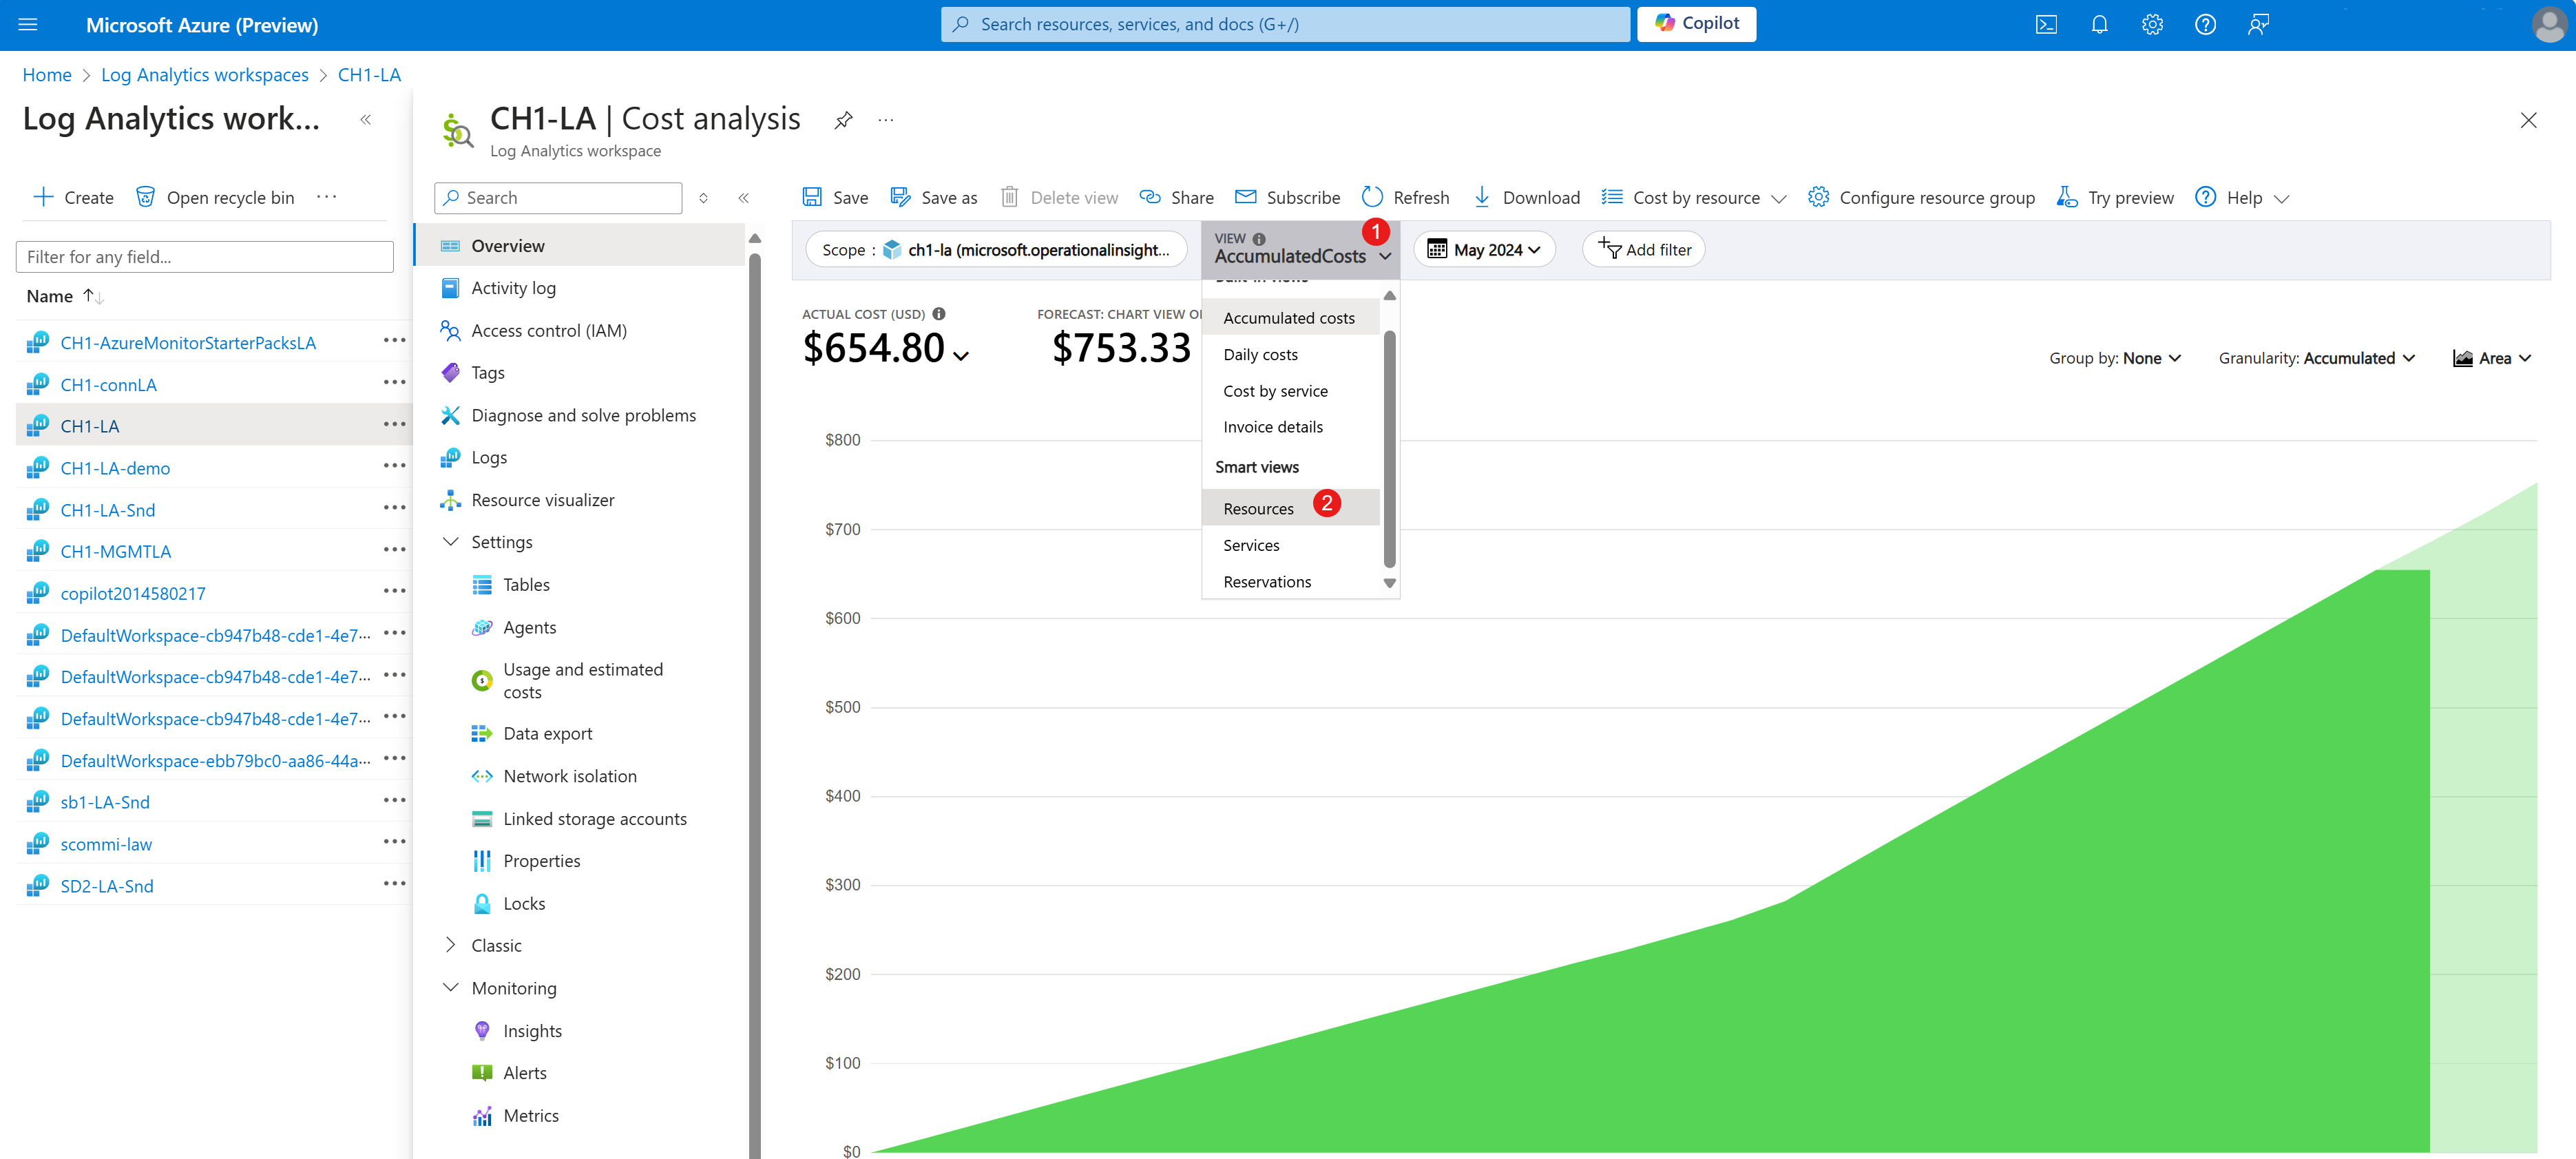
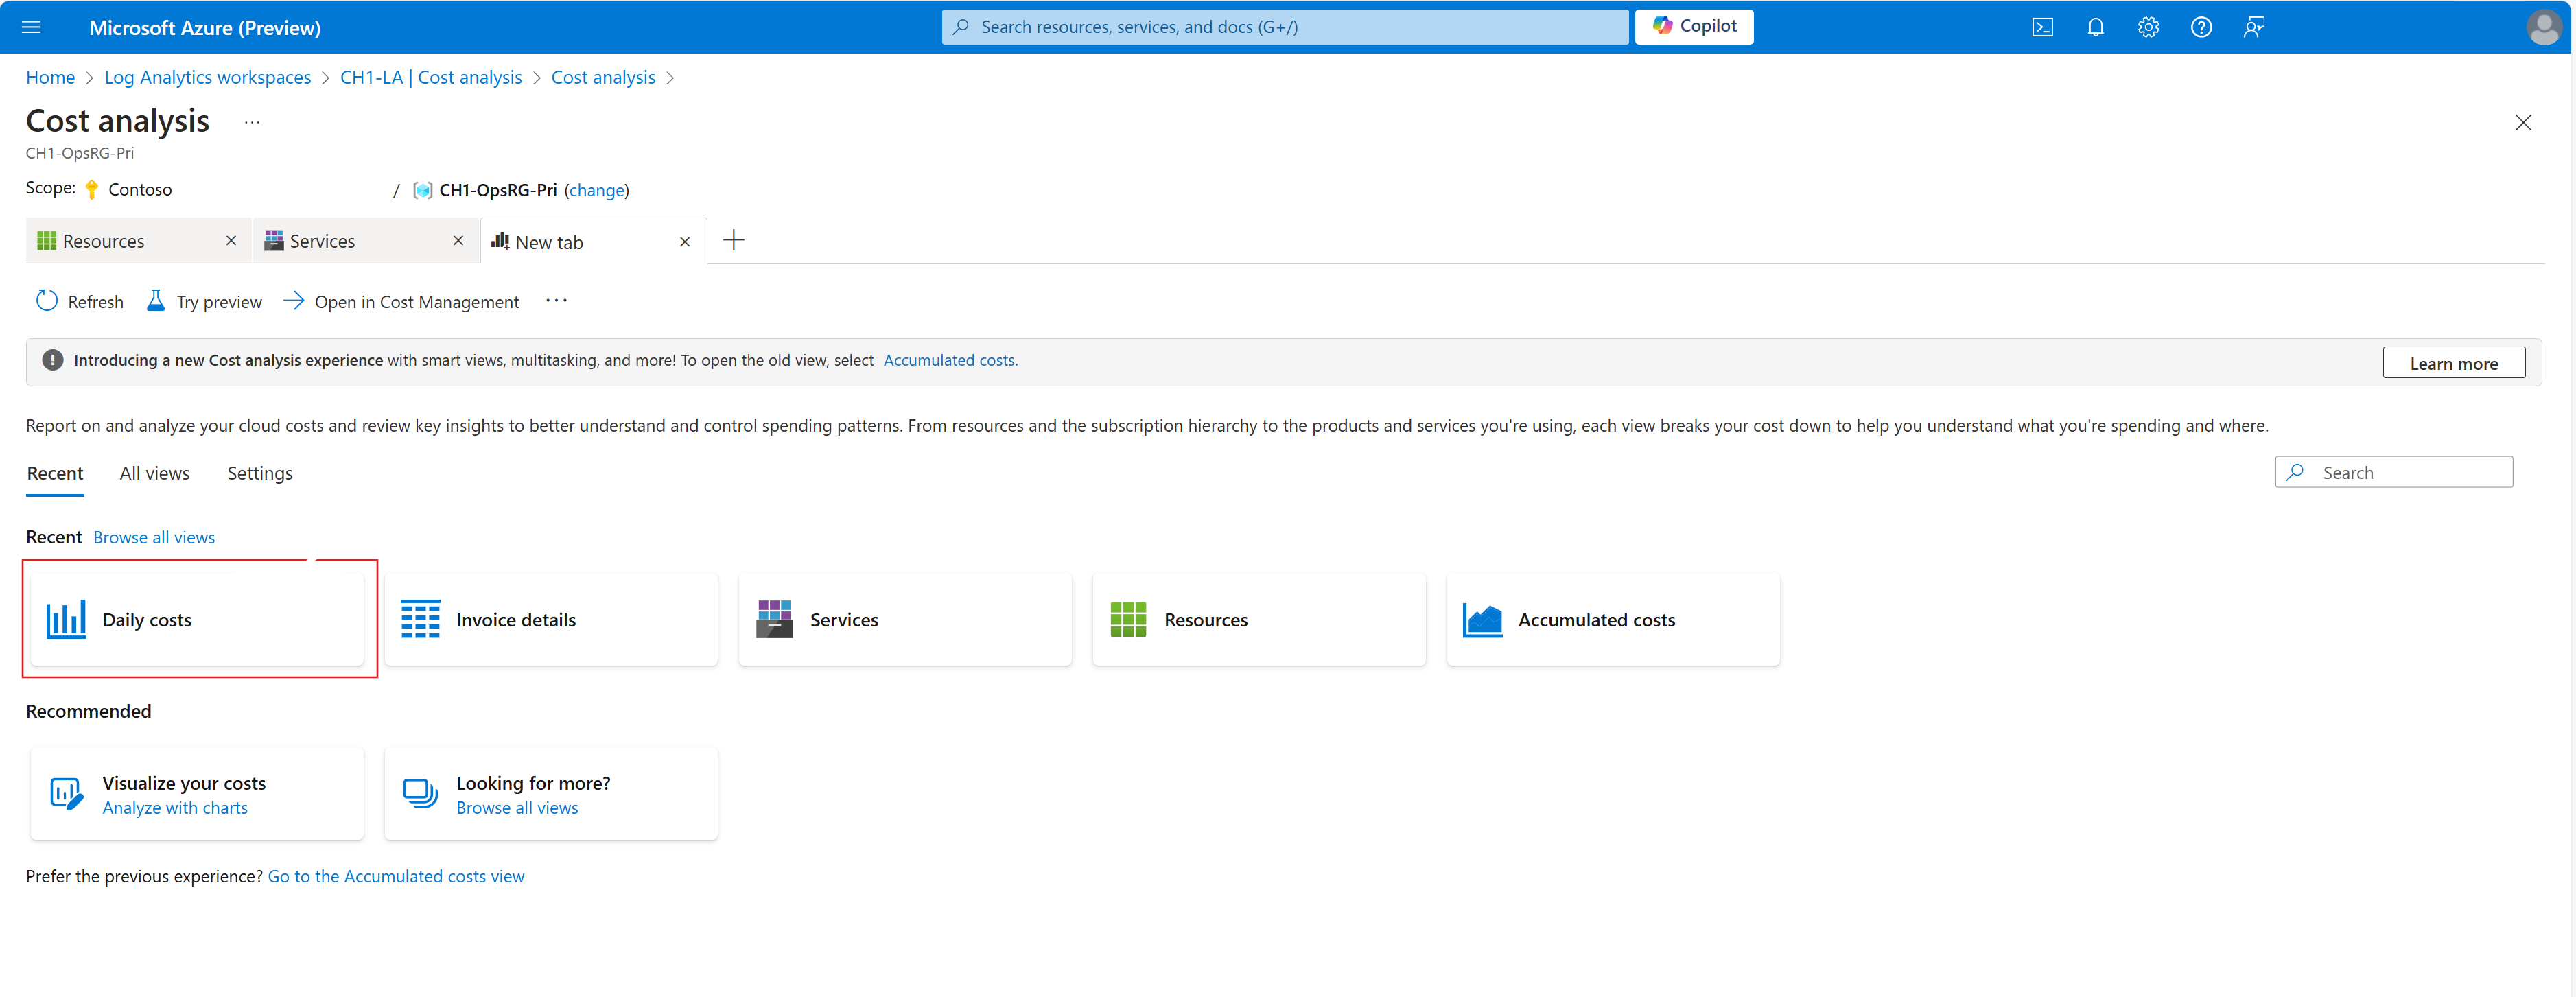
On the Cost analysis page, select View AccumulatedCosts, and then select Resources.
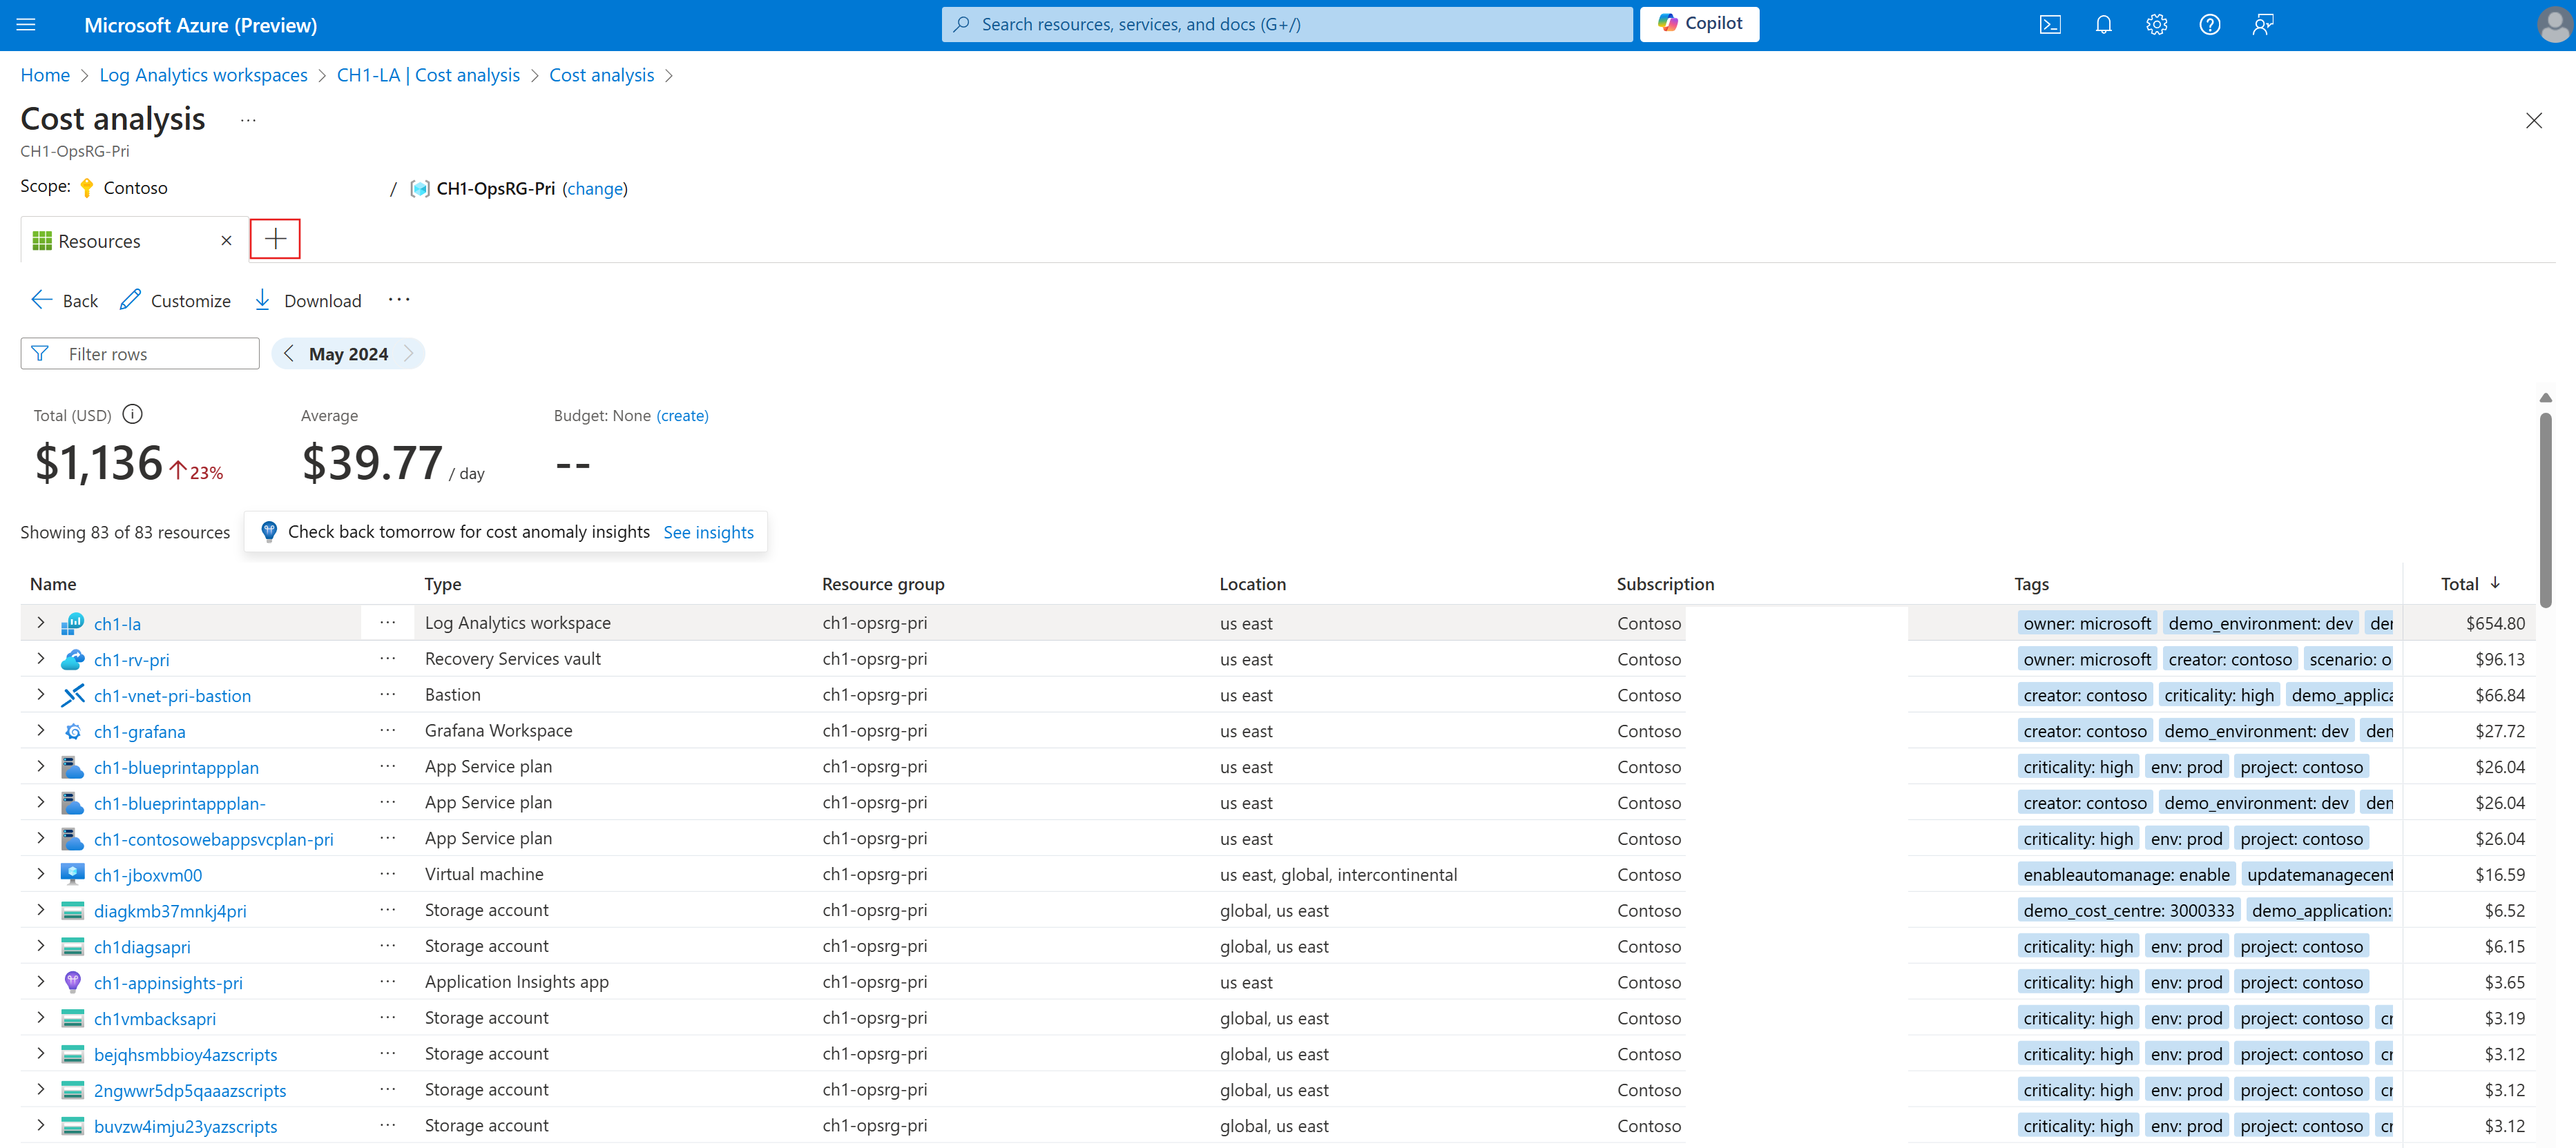
Select the plus sign (+) to open a new tab.
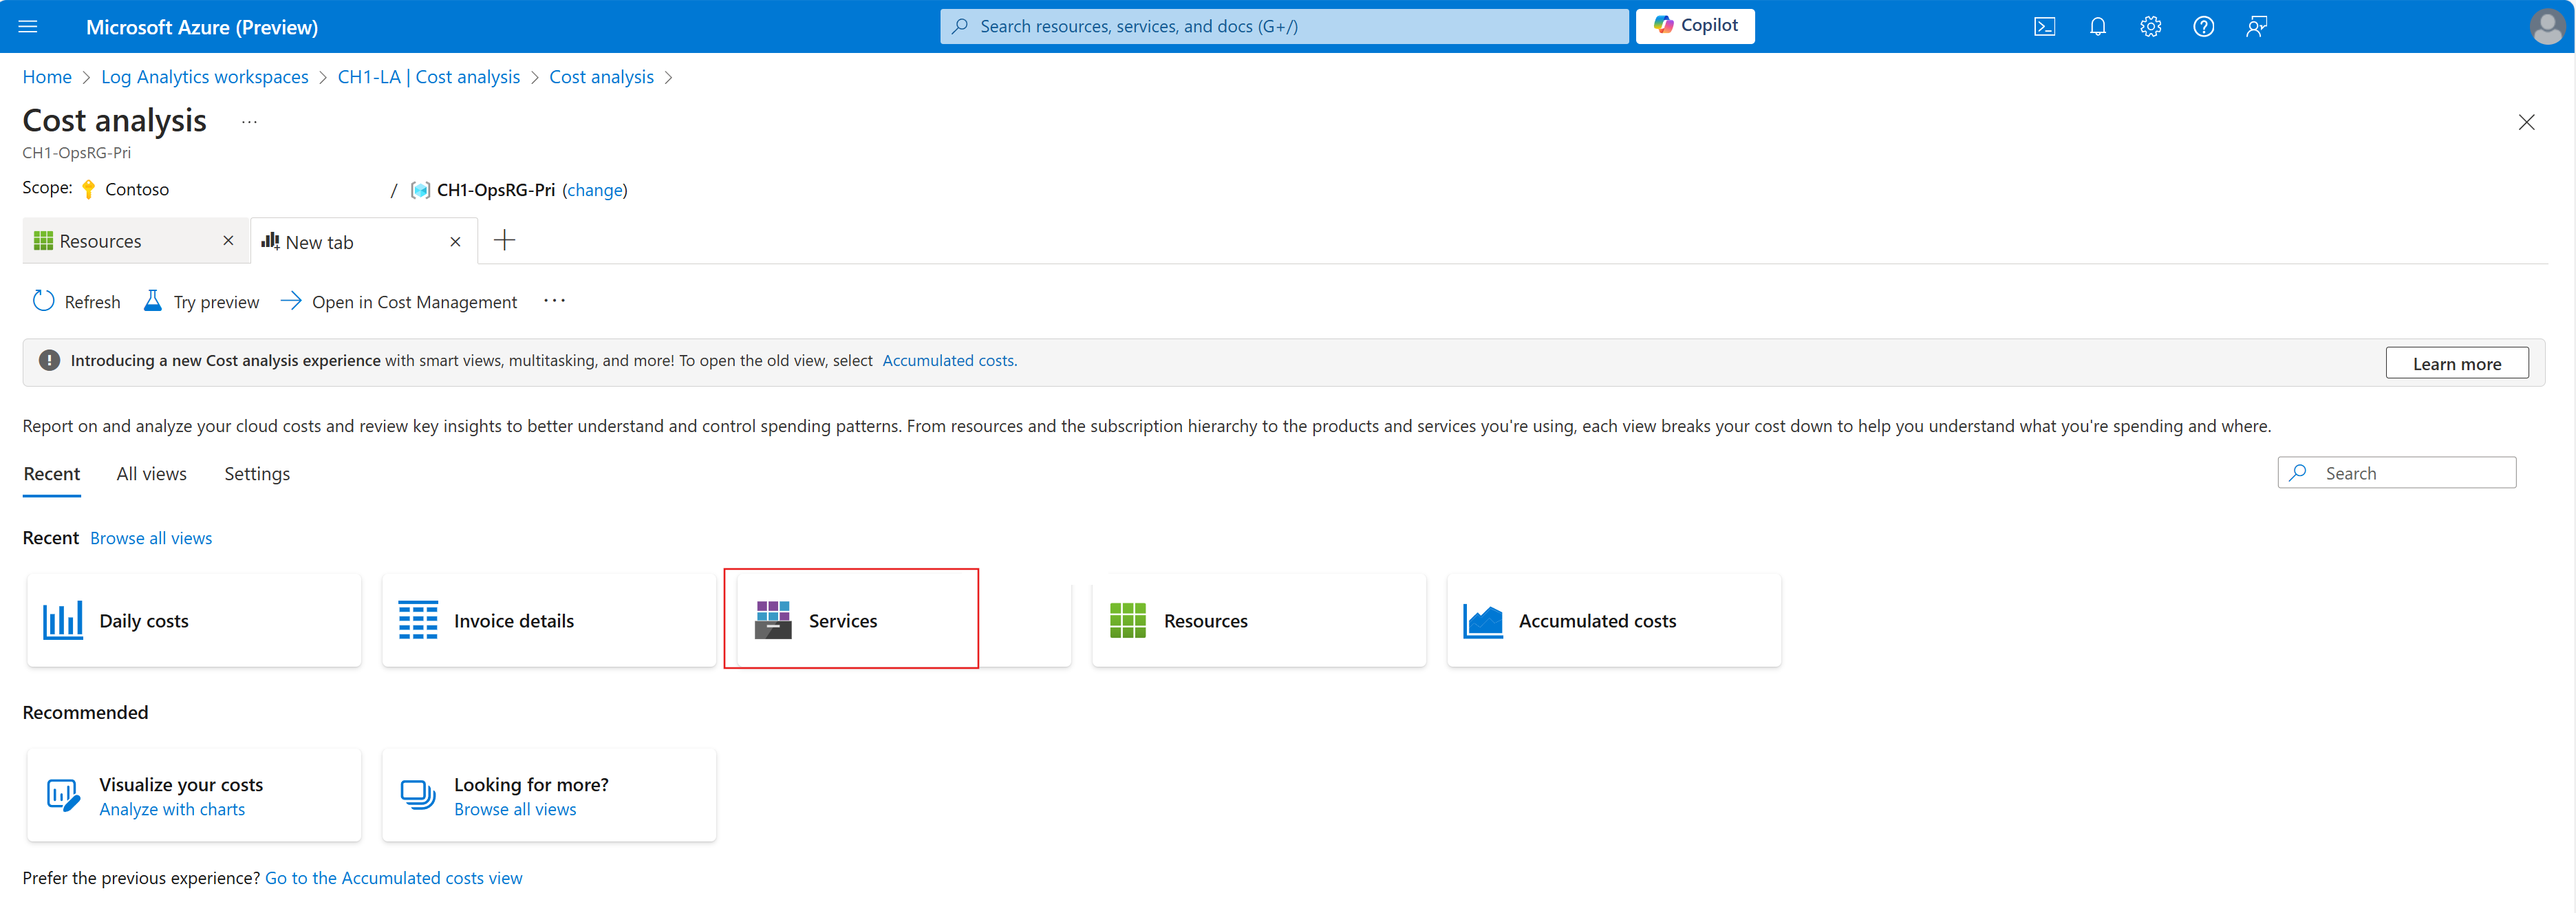
In the new tab, select Services.
Select the plus sign (+) to open a new tab, and then select Daily costs.
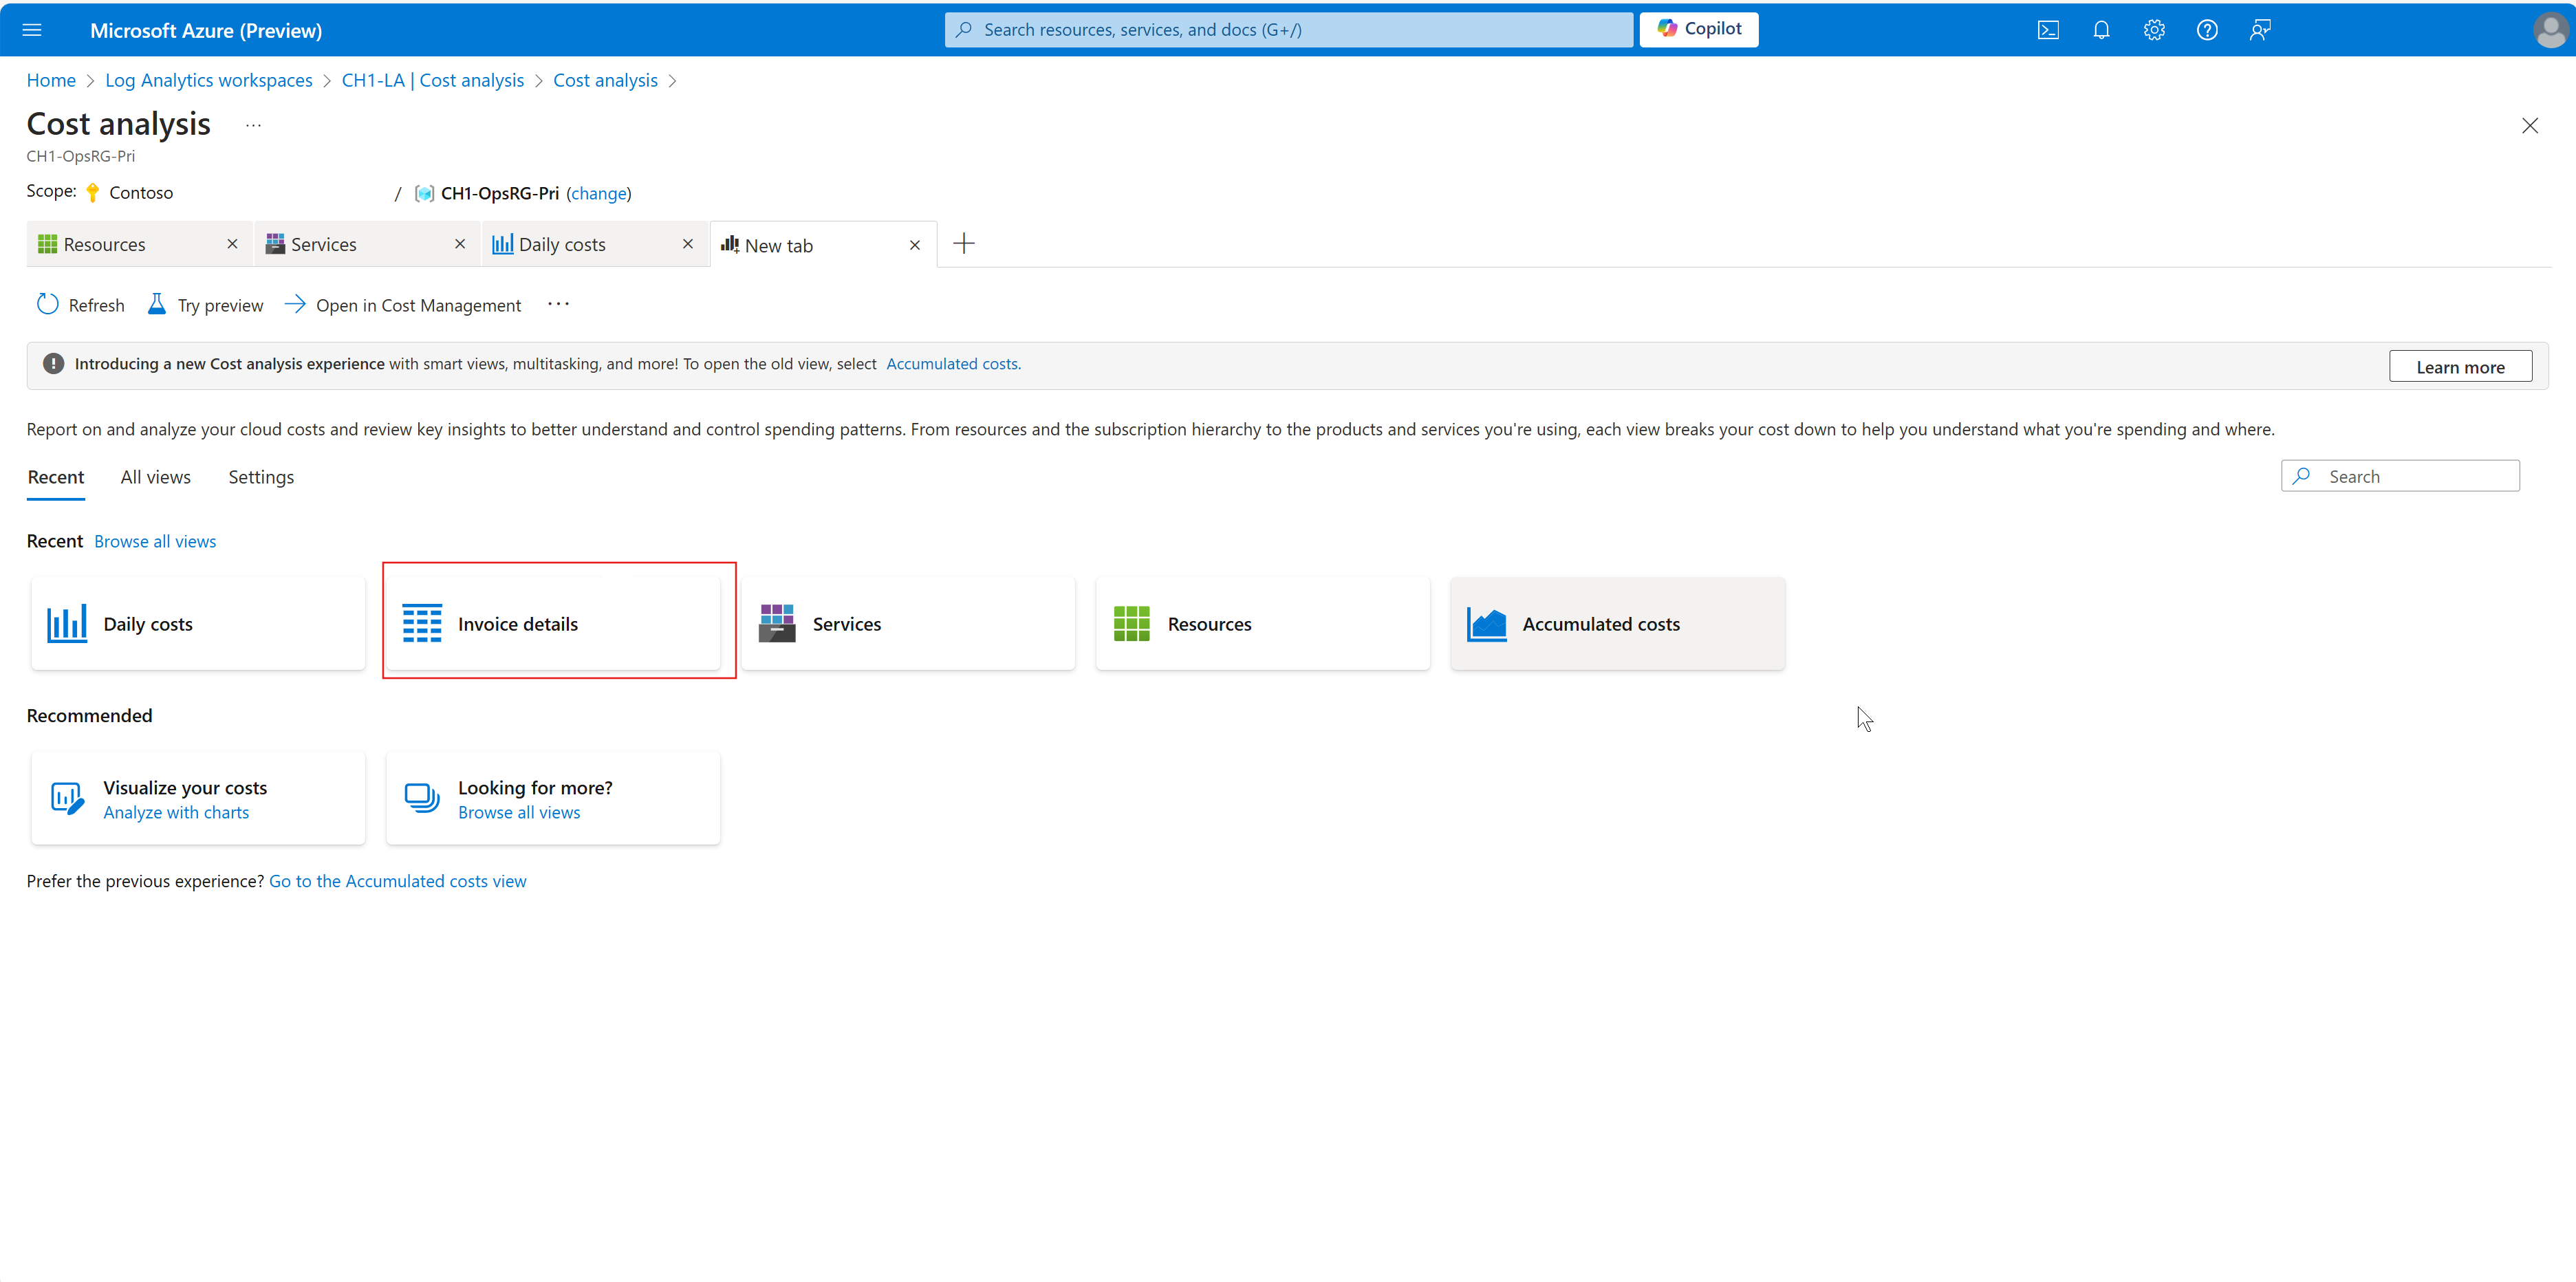
Select the plus sign (+) to open a new tab, and then select Invoice details.
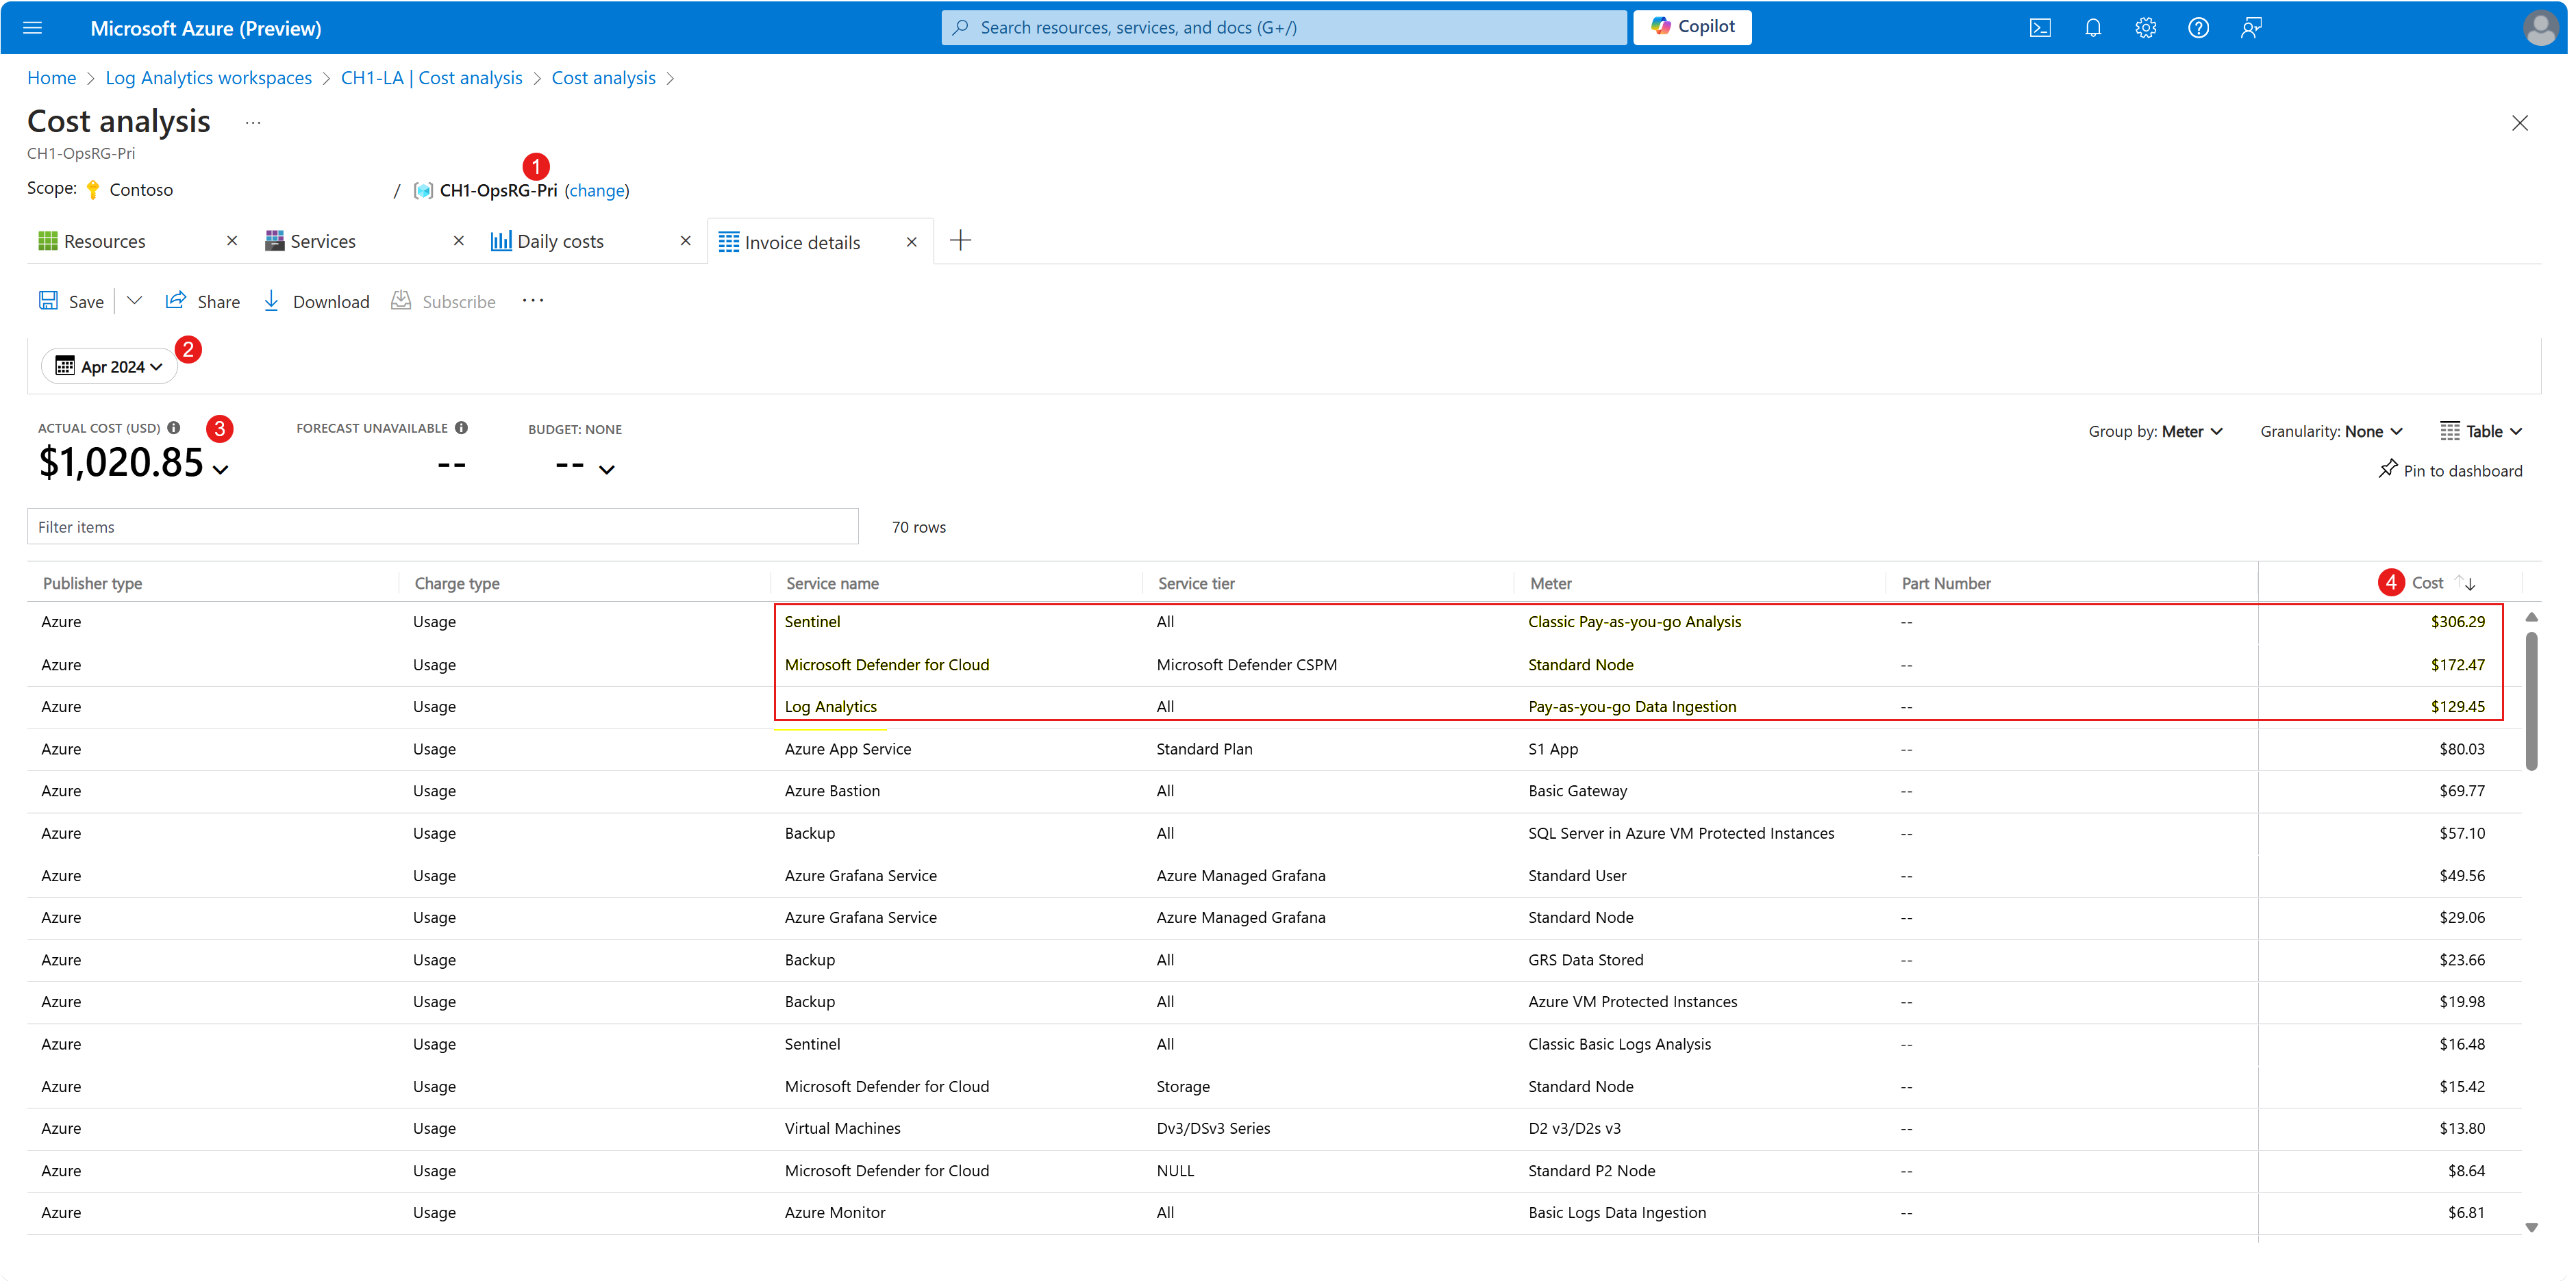
You can now start reviewing and analyzing your cost for detailed assessment.
- Ensure that the appropriate resource group (1) is selected.
- Record the specific month (2) being examined for this billing cycle.
- Note the total actual cost (3) for the selected month, ensuring it matches your invoice.
- Sort in descending order by cost (4), paying attention to the services with the highest cost.
In the following example of the Invoice details, it shows that the Log Analytics meter displays lower usage compared to other services that send data to the Log Analytics workspace. This discrepancy suggests an area for further investigation or optimization of how these services use resources within the current Log Analytics workspace.
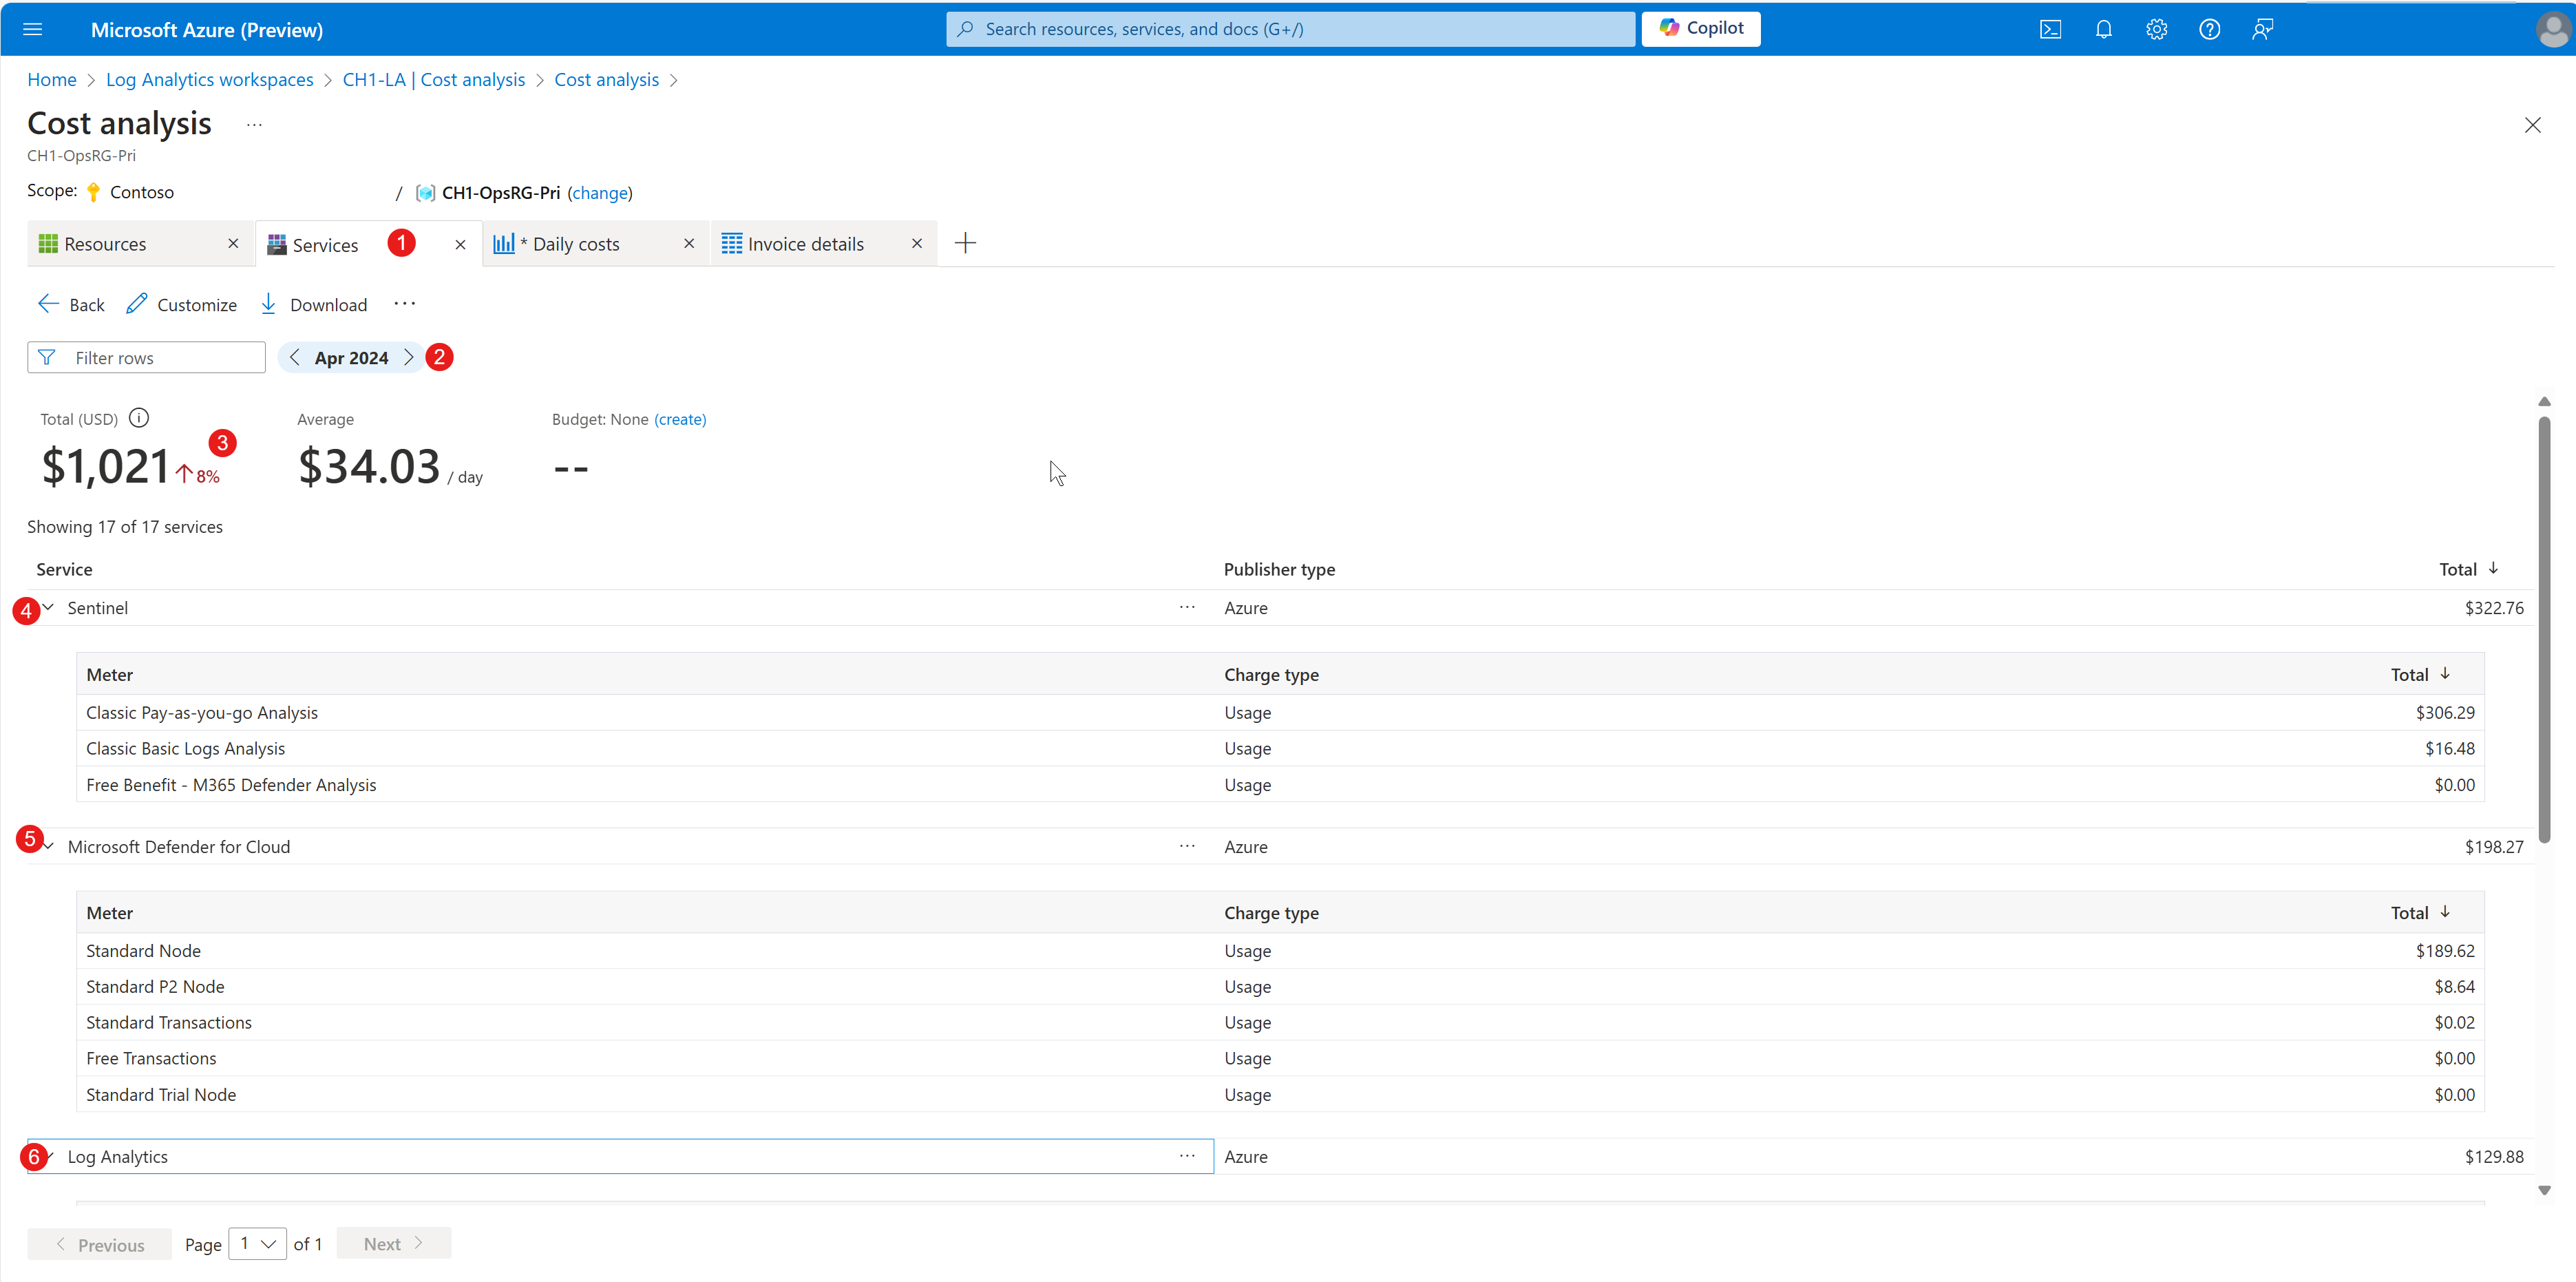
Switch to the Services tab (1), and then:
- Update the date range (2) to match the specific month that you're examining for this billing cycle.
- Ensure that the total cost (3) matches your invoice details.
- Expand each service to view the charge type per service (4)(5)(6).
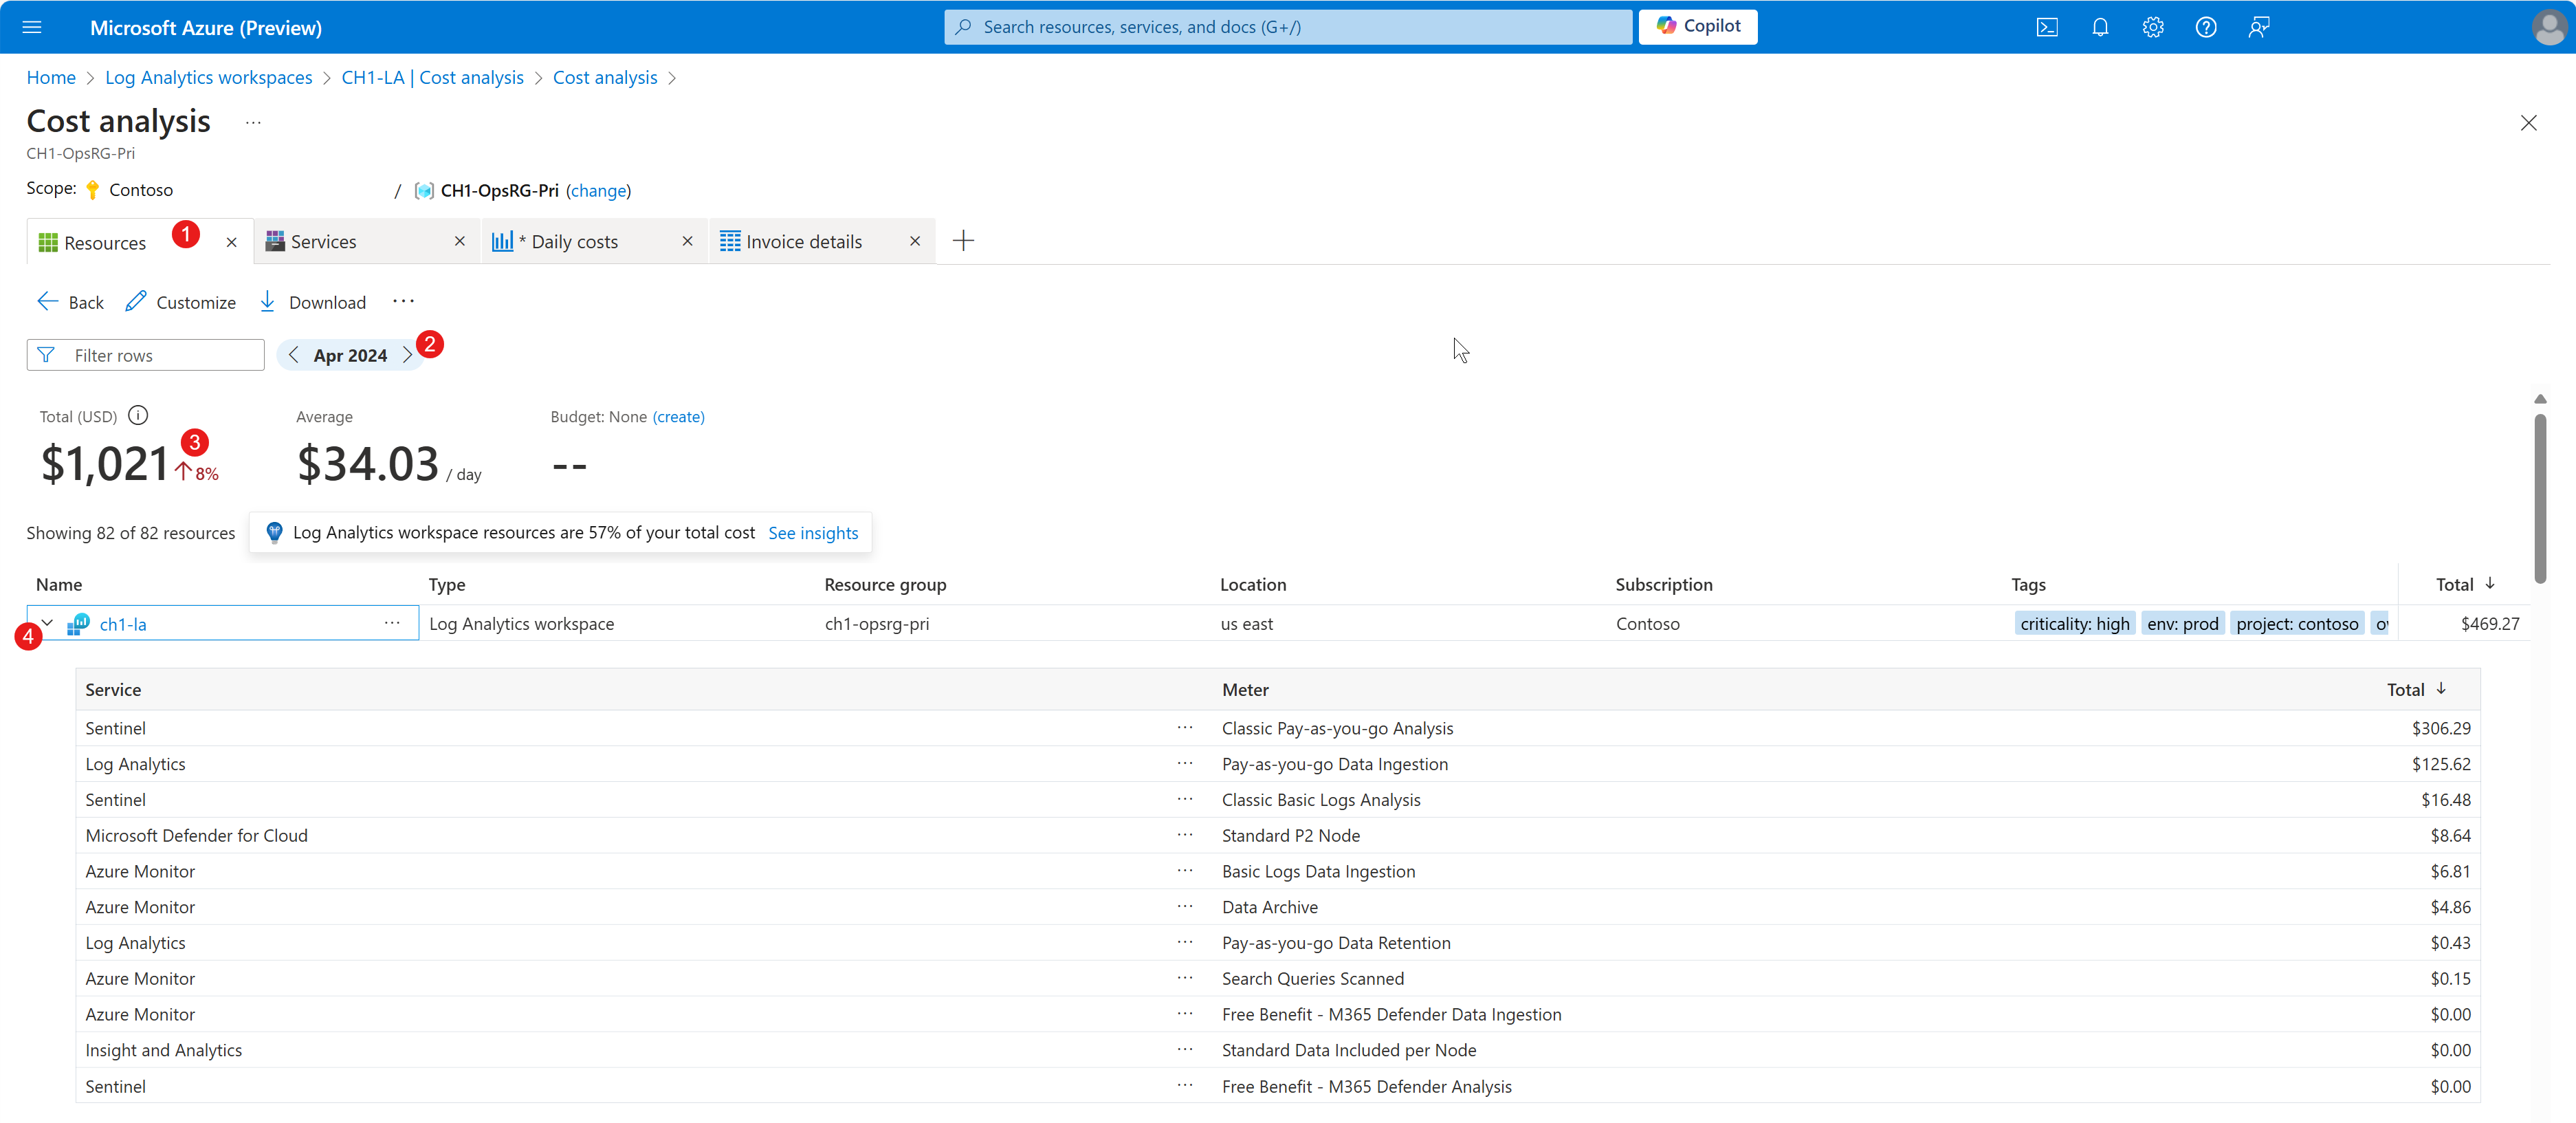
Switch to the Resources tab (1), and then:
Update the date range (2) to match the specific month that you're examining for this billing cycle. The total should now match the invoice details.
The default view of the Resources tab shows the total cost (3) of the Log Analytics workspace, including the cost of data ingested from other services.
To gain a comprehensive view of expenses associated with your Log Analytics workspace, select on the arrow (4) next to the Log Analytics workspace name. Initially, without delving into individual line items, one might incorrectly assume that the Log Analytics workspace incurs prohibitively high costs. However, upon expanding and examining each service's contribution within this workspace, you discover that it is not the Log Analytics workspace itself but rather the data-injecting services that primarily drive the overall cost.
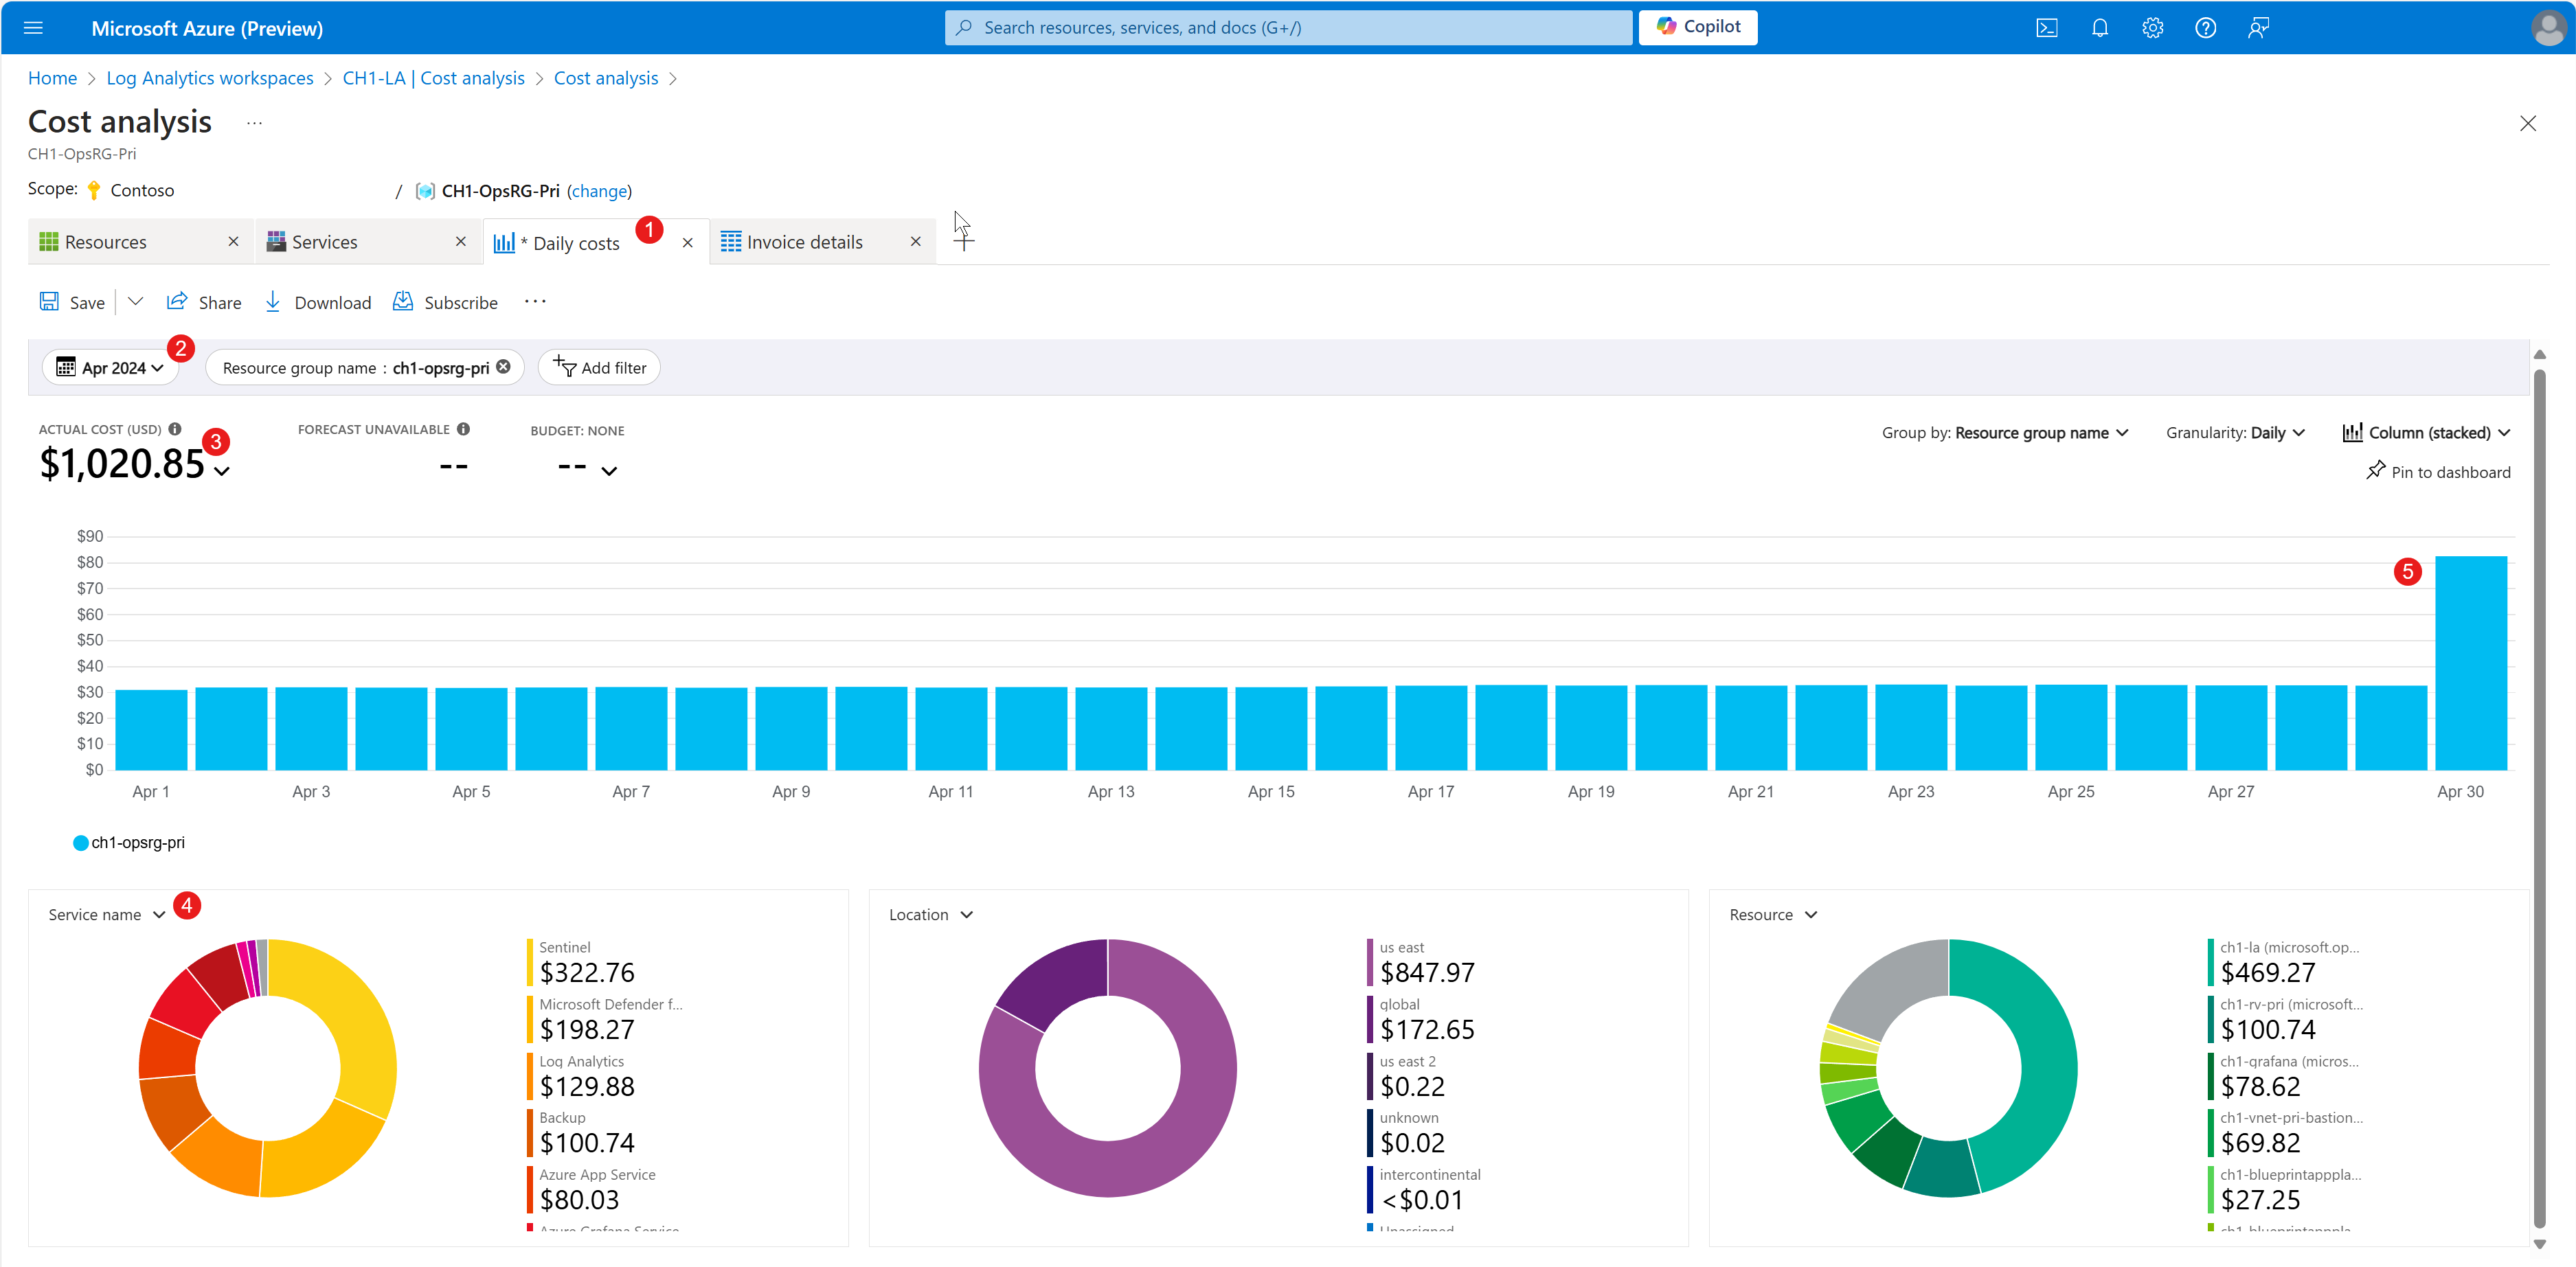
Switch to the Daily costs tab (1), and then:
- Update the date range (2) to match the specific month that you're examining for this billing cycle.
- Ensure that the total cost (3) matches your invoice details.
- The Service name pie (4) chart displays an alternative view that shows that data injection services are primarily responsible for driving the overall cost.
- The bar chart displays a cost increase at the end of the month (5). This can be further investigated to determine the root cause.


Next steps
Contact us for help
If you have questions or need help, create a support request, or ask Azure community support. You can also submit product feedback to Azure feedback community.