Note
Access to this page requires authorization. You can try signing in or changing directories.
Access to this page requires authorization. You can try changing directories.
Applies to: .NET Core 2.1, .NET Core 3.1, .NET 5
This article discusses the installation of ProcDump tool and how to capture .NET Core memory dump files by using ProcDump in Linux.
Prerequisites
The minimum requirements to follow these troubleshooting labs are as follows:
- An ASP.NET Core application to demonstrate low-CPU and high-CPU performance problems and crash issues.
- The lldb debugger, installed and configured to load SOS extension when a core dump file is opened.
If you have followed the previous parts of this series, you should have the following setup ready to go:
- Nginx is configured to host two websites:
- The first listens for requests by using the myfirstwebsite host header (
http://myfirstwebsite) and routing requests to the demo ASP.NET Core application that listens on port 5000. - The second listens for requests by using buggyamb host header (
http://buggyamb) and routing requests to the second ASP.NET Core sample buggy application that listens on port 5001.
- The first listens for requests by using the myfirstwebsite host header (
- Both ASP.NET Core applications should be running as services that restart automatically when the server is restarted or the application stops responding.
- The Linux local firewall is enabled and configured to allow SSH and HTTP traffic.
Note
If your setup isn't ready, go to "Part 2 Create and run ASP.NET Core apps."
Goal of this lab
In the previous labs, you learned how to analyze a crash or performance problem. You used the createdump tool to capture dump files.
Now, you'll install ProcDump, and capture core dump files by using ProcDump. That will be the extent of this lab because you'll work in the same scenario that you investigated in the previous part.
ProcDump
According to the official page of Linux version of ProcDump, "ProcDump is a Linux reimagining of the classic ProcDump tool from the Sysinternals suite of tools for Windows."
The Linux version has some limitations when compared with the Windows version. It doesn't support every feature that the Windows version of the tool offers. For example, it can't be configured to collect core dump files when the process crashes or throws a first chance exception.
However, it's still powerful. The following list of command-line options goes a long way in proving the strength of the tool:
-C: Trigger core dump generation when CPU exceeds or equals specified value (0 to 100 * nCPU)
-c: Trigger core dump generation when CPU is less than specified value (0 to 100 * nCPU)
-M: Trigger core dump generation when memory commit limit exceeds or equals specified value (MB)
-m: Trigger core dump generation when memory commit limit is less than specified value (MB)
-T: Trigger core dump generation when thread count exceeds or equals specified value.
-F: Trigger core dump generation when filedescriptor count exceeds or equals specified value.
Installation instructions are detailed on Install ProcDump. Recall that you were instructed to add the Microsoft package repository before you installed .NET Core. ProcDump uses the same repository. Therefore, you can directly install the tool by using the sudo apt install procdump command.

You can use ProcDump to monitor CPU, memory, thread, or file descriptor usages.
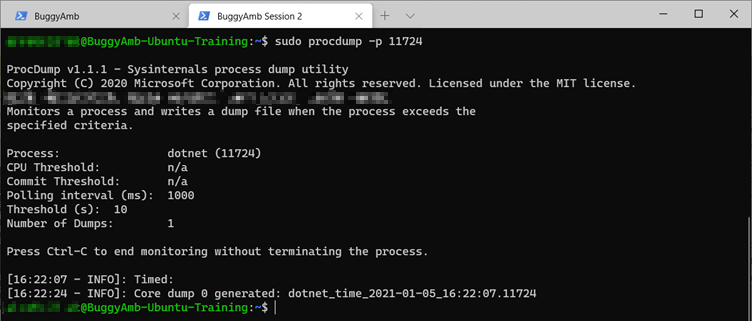
You can use ProcDump to capture a memory dump file when the target process CPU or memory usage reaches a certain threshold or drops below a limit value. However, for this exercise, you'll use the simplest method to invoke the tool: procdump -p <PID>. This manually creates a dump file of the process.
Capture a memory dump file of the same process. Notice that you'll have to run the command by using sudo.
Where does ProcDump create the core dump files?
This is the information that you'll certainly have to know. You could spend a lot of time trying to learn where the dump files are created when ProcDump is used to capture core dump files.
The ProcDump output isn't clear about where the core dump files are created. As shown in the previous screenshot, the output simply writes the name of the file, but not the actual path.
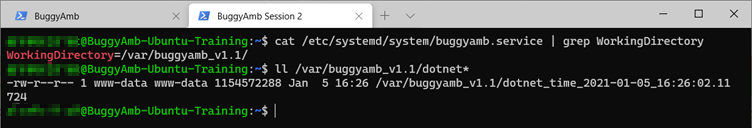
Because the other tools usually use the /tmp/ or /var/lib/systemd/coredump/ directories, you may think that the ProcDump also uses one of these directories. However, this isn't the case. Instead, the dump files that are captured by ProcDump are created in the ASP.NET Core application working directory.
The working directory for the application is defined in the service control unit file. As you can see in the following screenshot, the sample application's working directory is /var/BuggyAmb_v1.1. Therefore, any dump file that ProcDump creates for this application will be put into the /var/BuggyAmb_v1.1 directory.
Sample scenario: Capture dump files based on memory usage
Consider the following scenario:
- You're experiencing high-memory consumption on an ASP.NET Core application that you're hosting.
- The high memory consumption occurs randomly, and you don't know how to reproduce the problem. You know only that the problem starts when the commit memory usage for the process that hosts the application reaches 750 MB.
- Because you can't continuously monitor the memory usage, you want to automate the dump collection process. Your goal is to capture two consecutive dump files of the same process after the memory usage exceeds the 750 MB threshold.
- You want to capture two memory dump files, with at least a five-second interval between the generation of the first and second memory dump files.
According to ProcDump Help, here are the switches that you'll have to use:
-M: Trigger core dump file generation when memory commit exceeds or equals the specified value (MB)-n: Number of core dump files to write before exiting (default is 1)-s: Consecutive seconds before the dump file is written (default is 10)-d: Write diagnostic logs to Syslog-p: PID of the process
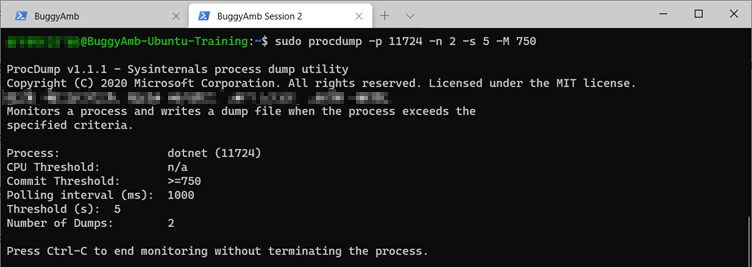
Run the sudo procdump -p 11724 -n 2 -s 5 -M 750 command. You'll see that ProcDump waits until the criteria that are defined by the arguments that are passed to it are met, or until you decide to end the monitoring phase by pressing Ctrl+C.
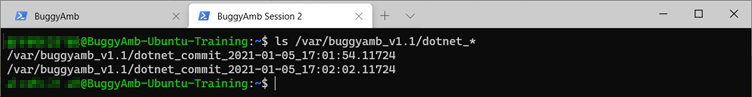
While ProcDump is monitoring the memory usage, reproduce the same problem by sending six requests to the Slow scenario by using the Load Generator feature of the web-application again. After the memory usage reaches the threshold, ProcDump creates dump files. The following screenshot shows two captured dump files.
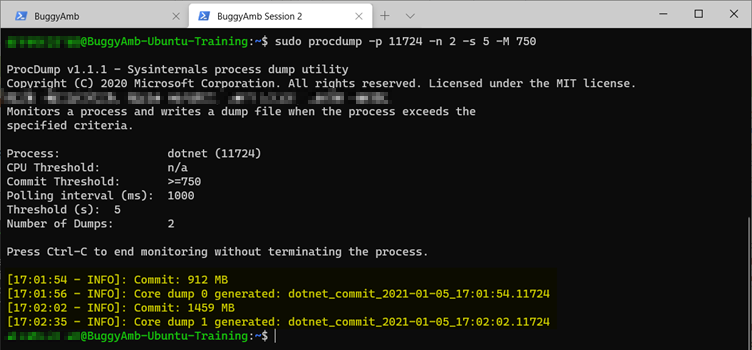
The dump files are written in the working directory, the same as it was the case of the manual memory dump file that you created earlier.
The dump files that are created by using createdump and ProcDump are identical in terms of the information that they contain. You can choose whichever tool you believe is better suited to the scenario that you face when you troubleshoot such problems.
Next steps
Lab 3 Troubleshooting performance and GC issues with dotnet-dump in Linux
Lab 3 discusses other options for working with memory dump files by using dotnet-dump and dotnet-gcdump.