Note
Access to this page requires authorization. You can try signing in or changing directories.
Access to this page requires authorization. You can try changing directories.
If your application is consuming high memory due to managed memory leaks, collect memory dumps of the process during the high memory usage event. These dumps can help you analyze and diagnose the cause of these leaks.
This article outlines the steps to capture memory dumps associated with managed memory leaks, both for consistently reproducible and intermittent cases.
For more information on how to analyze memory dumps along with an example scenario, see Troubleshooting example.
Memory leak issue is easily replicable
If the memory leak issue can be consistently reproduced whenever needed, use one of the following methods to capture data.
Method 1: Using Procdump
Note
If you're using Procdump for the first time, you need to accept the license agreement to use the tool.
Download and install the Procdump.exe tool on the server.
Run Command Prompt as an administrator.
In Command Prompt, navigate to the folder where Procdump.exe is saved.
Run the command:
procdump.exe -s 30 -ma -n 3 <PID>.Replace
<PID> with the actual PID of the w3wp.exe process that is facing the high memory issue. For more information on how to get the PID, follow steps in Identify high memory usage.-n: This parameter is the number of memory dumps to collect.-s: This parameter is the interval (in seconds) between dumps.
After the first memory dump is created, you see a confirmation in Command Prompt. By default, the memory dump is saved in the same location as procdump.exe.
If you're using other Procdump options that rely on specific conditions to trigger a dump, keep an eye on the PID. If it changes, you need to stop the command and run it again with the new PID. Otherwise, no memory dumps will be generated.
Method 2: Using DebugDiag
Download and install Debug Diagnostic Tool v2 Update 3.2.
When a memory leak occurs, open DebugDiag 2 Collection from the Start menu:

Note
If you need to change the path where dumps are generated, select Tools > Options And Settings > Manual Userdump Save Folder to change it.
Select the Processes tab.
Locate the w3wp process with the Process ID column of the application in question.
Replace
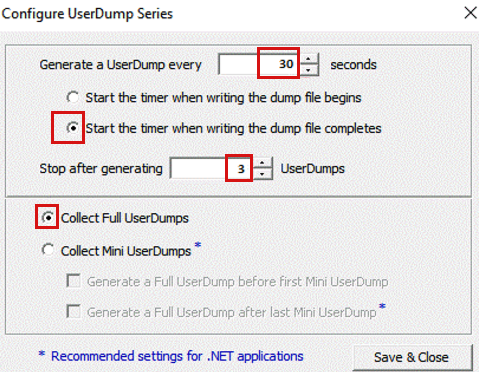
<PID> with the actual PID of the w3wp.exe process that is facing the high memory issue. For more information on how to get the PID, follow steps in Identify high memory usage.Right-click the w3wp process, select Create Userdump Series, and set the following options (adjust the numbers as needed). Don't select Save & Close.
Once the memory consumption of w3wp.exe reaches the limit as described in the Memory limits for different scenarios, select Save & Close.
The dumps will start generating immediately.
Memory leak issue is intermittent
If the memory leak issue is intermittent, you can automate the data capture process using the following steps:
Note
If you're using Procdump for the first time, you need to accept the license agreement to use the tool.
Download and install the Procdump.exe tool on the server.
Run Command Prompt as an administrator.
In Command Prompt, navigate to the folder where Procdump.exe is saved.
Run the command:
procdump.exe -s 30 -m <memoryConsumption> -ma -n 3 <PID>.Replace
<PID> with the actual PID of the w3wp.exe process that is facing the high memory issue. For more information on how to get the PID, follow steps in Identify high memory usage.-n: This parameter is the number of memory dumps to collect.-m: This parameter is the memory commit threshold (in MB) for creating dumps.-s: This parameter might have different meanings based on the other parameters in theprocdumpcommand.
When you use
-min the command,-sindicates the number of consecutive seconds during which w3wp.exe's memory consumption is >= the threshold specified by-m.For example, if the command is
procdump.exe -s 30 -m 5120 -ma -n 3 <PID>, the process memory consumption must be >= 5,120 MB (5 GB) for at least 30 seconds to generate a dump. If the first dump is written but then memory drops to less than 5,120 MB, the second and third dumps won't be collected, and the memory must increase back to 5,120 MB or higher and remain so for 30 seconds for the second dump to be generated, and so on. So,-shere doesn't necessarily mean the interval between the dumps.
After the first memory dump is created, you see a confirmation in Command Prompt. By default, the memory dump is saved in the same location as procdump.exe.
If you're using other Procdump options that rely on specific conditions to trigger a dump, keep an eye on the PID. If it changes, you need to stop the command and run it again with the new PID. Otherwise, no memory dumps will be generated.