Note
Access to this page requires authorization. You can try signing in or changing directories.
Access to this page requires authorization. You can try changing directories.
This troubleshooting guide provides steps to diagnose and resolve high memory consumption issues in applications, focusing on scenarios involving memory leaks. It helps you understand typical symptoms, limits related to memory usage in different system configurations, and the tools required to diagnose the issue effectively.
Data capture tools
Note
- Avoid using Task Manager to collect memory dumps. Specialized tools like DebugDiag and Procdump are more effective for ASP.NET applications as they understand managed code better and handle process bitness automatically.
- Multiple attempts might be needed to get a useful set of memory dumps.
- Ensure you have sufficient disk space for memory dumps. Each dump is approximately the size of the process at that time. For instance, if the process is 1 gigabyte (GB), generating three dumps requires about 4 GB of space.
Memory limits for different scenarios
Memory leaks generally result in a steady increase in memory usage, leading to crashes or performance degradation:
Note
High memory usage doesn't always indicate a leak; processes might recover if the allocated memory is freed later. A memory leak is caused by one or more bugs in the application where allocations are never freed.
- 32-bit applications: 32-bit applications might crash and throw an
OutOfMemoryexception when running out of memory, possibly without reporting errors before crashing. They can behave unpredictably if memory allocation failures aren't handled properly in the application code. - 64-bit applications: 64-bit applications rarely fail when trying to allocate virtual memory due to the large address space. However, they can grow to have a very large virtual address space and cause excessive paging of physical memory, which affects the application and other applications that are competing for physical memory.
| Scenario | Memory limit | More information |
|---|---|---|
| 32-bit applications on 32-bit Windows | 4 GB in total (2 GB in user mode, 2 GB in kernel mode) | If you use the /LARGEADDRESSAWARE flag in your 32-bit applications and the /3GB switch in the boot.ini file of the operating system during boot time, it makes the user mode memory 3 GB and the kernel mode 1 GB. |
| 32-bit applications on 64-bit Windows | 4 GB in total (2 GB in user mode, 2 GB in kernel mode) | If you use the /LARGEADDRESSAWARE flag in your 32-bit applications, it makes the user mode memory 4 GB. The kernel doesn't use the 32-bit address space on a 64-bit operating system. It uses only the required space from the 64-bit address space. |
| 64-bit applications on 64-bit Windows | 2^64 bytes = 16 Exabyte (EB) (~100 Crore GB). However, Windows10 x 64 supports 48 bits virtual address: 2^48 bytes = 256 TB (128 TB in user mode, 128 TB in kernel mode). | NA |
| 64-bit applications on 32-bit Windows | Invalid scenario | NA |
Identify high memory usage
The simplest way to identify high memory usage is to monitor the Private Bytes (KB) counter using the Worker Processes module of Internet Information Services (IIS) Manager. The Private Bytes (KB) counter indicates the amount of private committed memory used by a process.
To monitor Private Bytes (KB), follow these steps:
Open IIS Manager.
Select your server name (on the left).
Double-click Worker Processes.
Check Private Bytes (KB). Here's a screenshot:
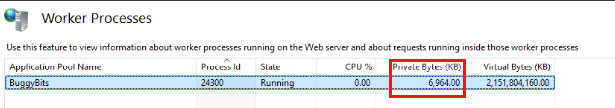
If the Private Bytes (KB) value for the w3wp.exe process (IIS worker process) reaches the memory limit as described in the Memory limits for different scenarios, the w3wp.exe process has a high memory issue. The Process Id and Application Pool Name are shown next to it. You might need to refresh this view manually.
Identify whether the memory leak is managed or native
Once you've confirmed that the w3wp.exe process is experiencing high memory usage, the next step is to identify whether it's a managed or native memory leak. Follow these steps to identify the type of memory leak:
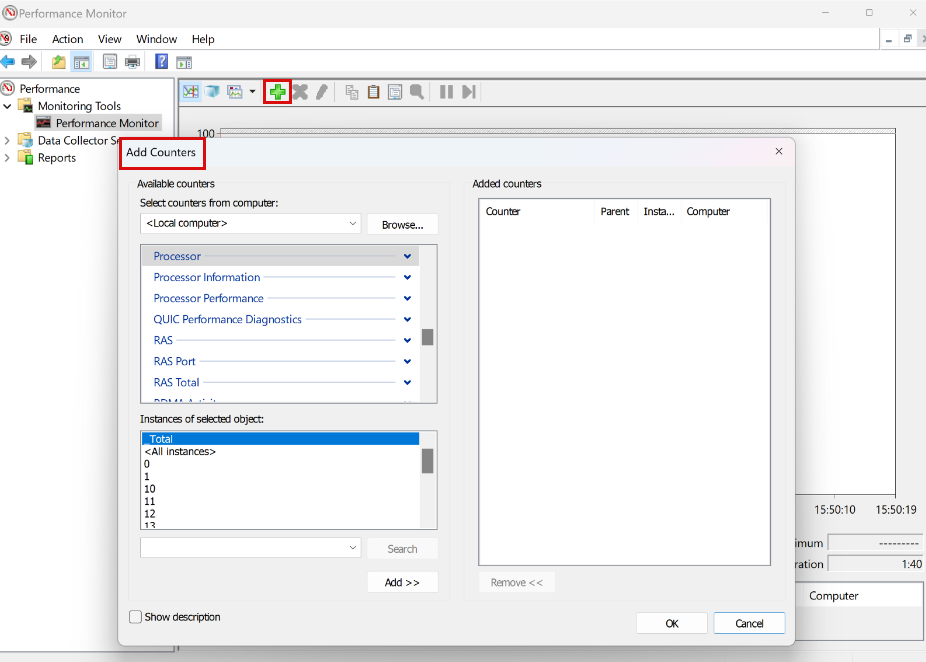
Open Performance Monitor and select the + icon to add counters.
Select # Bytes in all Heaps under the .NET CLR Memory counter, select the target process (here, it's w3wp), and then select Add.
Select Private Bytes and Virtual Bytes under the Process counter, select the target process, and then select Add (you can ignore the working set).
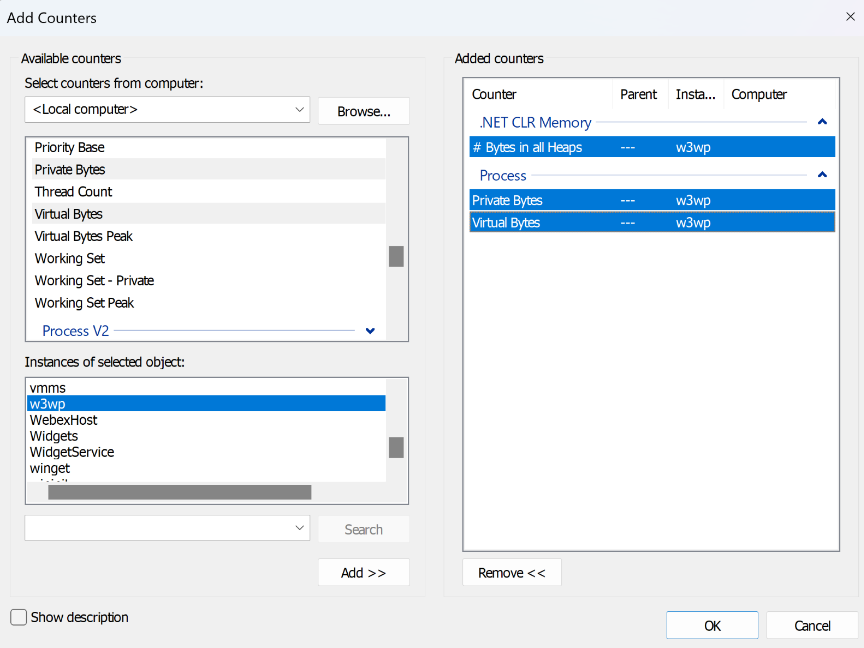
Select OK.
Reproduce the issue.
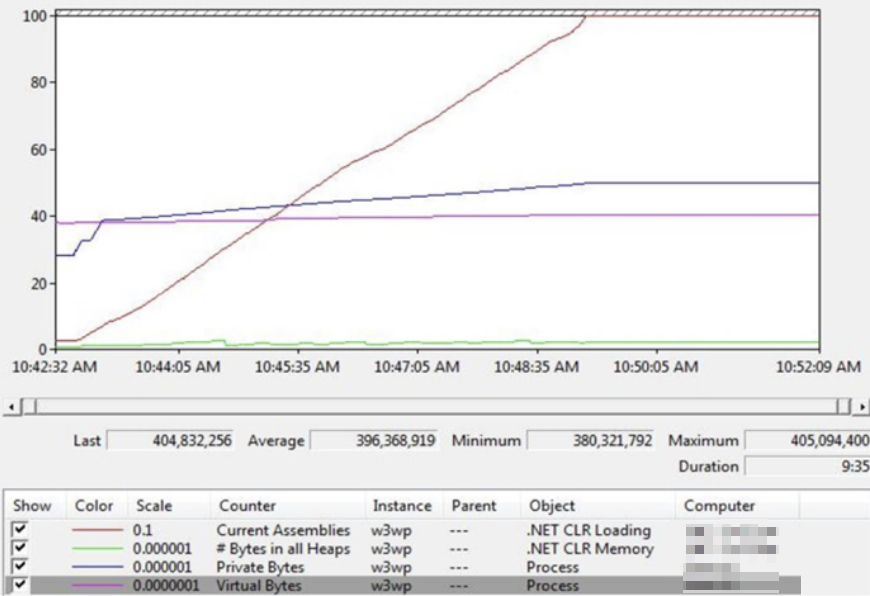
To verify whether it's a managed or native memory leak, monitor the counters:
Managed memory leak: If the Private Bytes counter and the Virtual Bytes counter increase at the same rate (the difference between them remains constant), it indicates a managed memory leak.
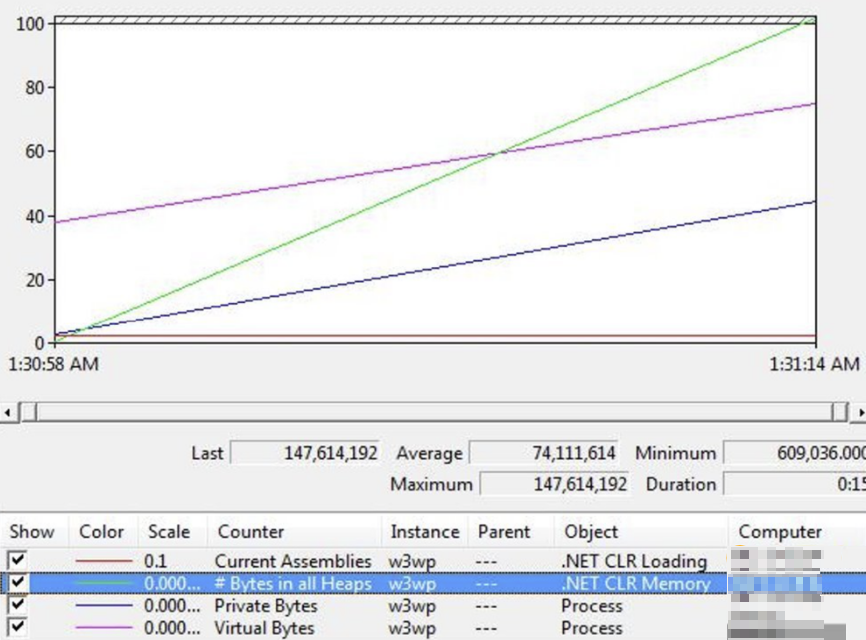
Native memory leak: If the Private Bytes counter increases but the # Bytes in all Heaps counter remains constant, it indicates a native memory leak.

Data collection
Once you've confirmed the type of memory leak, the next step is to use tools to collect memory dumps of the process during the high memory usage event. These dumps can help you analyze and diagnose the cause of the issue.
- To collect dumps for managed memory leaks, see Data capture for managed memory leaks.
- To collect dumps for native memory leaks, see Troubleshoot native memory leak in an IIS 7.x application pool.
.NET Core applications
If the application in question is .NET Core and hosted on IIS in in-process mode, use the data collection steps in Data capture for managed memory leaks. However, if the application is hosted on IIS in out-of-process mode, modify the actions to investigate the dotnet process (dotnet.exe unless otherwise specified) instead of w3wp.exe. The same thing applies to self-hosted .NET Core applications.
Troubleshooting example
Assume you have an application hosted on an IIS server and you experience high memory usage (the memory spikes up to around 7 GB by doing a stress test) when accessing a specific URL, follow these steps to diagnose the issue:
Check Performance Monitor by following the steps in Identify whether the memory leak is managed or native. If you notice the difference between Private Bytes and Virtual Bytes remains constant, it's a managed memory leak.
Collect dump files by following the steps described in Using DebugDiag.
Open the dump files in WinDbg. For high memory scenarios, you can use the following commands:
Command Usage !dumpheap -statThis command shows you all objects on the managed heap and their statistics. You can customize the output using the different switches of !dumpheapto focus on specific types of objects, sizes, or states, making it easier to analyze the managed heap and identify issues such as memory leaks.!eeheap -gcThis command can be used to get the managed heap size. !threadsThis command helps check for any finalizer threads that display all managed threads. !finalizequeueThis command is used to display all objects in the finalize queue. After running
!dumpheap -stat, you see thatsystem.char[],system.Text.Stringbuilder, andBuggyBits.Models.Linkconsume the most objects on the heap, with counts of 322,547, 322,408, and 320,031.Note
BuggyBitsis the sample application name used in this example. You might see your application name or other process name which might be consuming high objects.7ff93da4a520 601 1,00,968 Microsoft.AspNetCore.Mvc.TagHelpers.ScriptTagHelper 7ff93dbbe068 2,576 1,03,040 Microsoft.AspNetCore.Mvc.ViewFeatures.TemplateInfo 7ff93dcb56f8 1,202 1,05,776 Microsoft.AspNetCore.Razor.TagHelpers.TagHelperOutput 7ff93dbff3f0 1,245 1,09,560 Microsoft.AspNetCore.Mvc.ViewFeatures.HtmlHelper<System.Object> 7ff93db563b8 1,258 1,10,640 System.Collections.Generic.KeyValuePair<System.Func<System.Object, System.Threading.Tasks.Task>, System.Object>[] 7ff93dd01268 4,720 1,13,280 Microsoft.AspNetCore.Html.HtmlContentBuilder 7ff93dd01b40 4,721 1,13,304 Microsoft.AspNetCore.Mvc.ViewFeatures.AttributeDictionary 7ff93da51af0 1,202 1,15,392 Microsoft.AspNetCore.Razor.Runtime.TagHelpers.TagHelperExecutionContext 7ff93d230af0 5,013 1,20,312 System.Object <<< omitting few to save space>>> 7ff93dbc4c38 644 1,85,472 AspNetCore.Views_Links_Index 7ff93dbc7b50 644 1,85,472 AspNetCore.Views__ViewStart 7ff93d55f218 4,722 1,88,880 Microsoft.AspNetCore.Routing.RouteValuesAddress 7ff93dbc6fa0 601 2,16,360 AspNetCore.Views_Shared__Layout 7ff93dd01738 4,720 2,26,560 Microsoft.AspNetCore.Mvc.Rendering.TagBuilder 7ff93d236618 990 2,28,360 System.Object[] 7ff93dade018 644 2,47,296 System.IO.Pipelines.Pipe 7ff93dad9da0 644 2,57,600 Microsoft.AspNetCore.HttpSys.Internal.RequestHeaders 7ff93dcf4de8 4,720 2,64,320 System.Linq.Enumerable+<OfTypeIterator>d__61<Microsoft.AspNetCore.Routing.RouteEndpoint> 7ff93dc9be58 3,711 2,68,368 Microsoft.AspNetCore.Mvc.ViewFeatures.Buffers.ViewBufferValue[][] 7ff93dce0188 4,723 3,02,272 Microsoft.AspNetCore.Mvc.Routing.UrlActionContext 7ff93dc9b4e0 9,540 3,05,280 Microsoft.AspNetCore.Mvc.ViewFeatures.Buffers.ViewBufferPage 7ff93dcb71d0 7,690 3,07,600 Microsoft.Extensions.Internal.CopyOnWriteDictionary<System.Object, System.Object> 7ff93dcbe430 4,752 3,33,440 Microsoft.AspNetCore.Mvc.ViewFeatures.Buffers.ViewBufferPage[] 7ff93dcb7fd8 8,880 3,55,200 Microsoft.AspNetCore.Razor.TagHelpers.TagHelperAttribute 7ff93dcb5110 5,925 3,79,200 System.Func<System.Threading.Tasks.Task> 7ff93db27c10 8,853 3,96,592 Microsoft.AspNetCore.Routing.RouteEndpoint[] 7ff93dad6a98 644 3,96,704 Microsoft.AspNetCore.Server.IIS.Core.IISHttpContextOfT<Microsoft.AspNetCore.Hosting.HostingApplication+Context> 7ff93dce6a08 4,722 4,15,472 Microsoft.AspNetCore.Routing.Tree.OutboundMatchResult[] 7ff93d4285d8 4,724 4,15,536 System.Collections.Generic.KeyValuePair<System.String, System.String>[] 7ff93dcbdea0 10,694 4,27,760 Microsoft.AspNetCore.Razor.TagHelpers.DefaultTagHelperContent 7ff93da559b0 10,097 5,65,432 Microsoft.AspNetCore.Mvc.ViewFeatures.Buffers.ViewBuffer 7ff93da46430 4,738 5,68,560 Microsoft.AspNetCore.Mvc.TagHelpers.AnchorTagHelper 7ff93dbf5ea8 10,063 8,05,040 Microsoft.AspNetCore.Mvc.ViewFeatures.Buffers.ViewBufferTextWriter 7ff93d94ba98 21,439 8,57,560 Microsoft.AspNetCore.Routing.RouteValueDictionary 7ff93daabd18 20,881 15,99,832 System.Collections.Generic.KeyValuePair<System.String, System.Object>[] 7ff93d2f2360 853 16,53,045 System.Byte[] 7ff93d2f1e18 23,943 17,47,166 System.String 7ff93da40928 3,20,031 1,02,40,992 BuggyBits.Models.Link 7ff93d4b7dc0 3,22,408 1,54,75,584 System.Text.StringBuilder 017e072f9d90 4,25,254 52,07,33,840 Free 7ff93d333058 3,22,547 6,40,93,53,398 System.Char[] Total 17,82,793 objects, 6,98,09,63,784 bytesDump the statistics for various sizes of
char[]to find out if there's a pattern (this is a trial-and-error process, so you have to try different sizes to determine where the bulk of the strings are).Run the command
!dumpheap -mt 7ff93d333058to list all objects on the managed heap that have the specified method table (MT) address7ff93d333058forSystem.Char[].Address MT Size 017e076607a0 7ff93d333058 20,024 017e07665640 7ff93d333058 20,024 017e0766a4e0 7ff93d333058 20,024 017e0766f380 7ff93d333058 20,024 017e07674220 7ff93d333058 20,024 017e076790c0 7ff93d333058 20,024 017e0767df60 7ff93d333058 20,024 017e07682e00 7ff93d333058 20,024 017e07687ca0 7ff93d333058 20,024 017e0768cb40 7ff93d333058 20,024 017e076919e0 7ff93d333058 20,024 017e07696880 7ff93d333058 20,024 017e0769b720 7ff93d333058 20,024 017e076a05c0 7ff93d333058 20,024 017e076a5460 7ff93d333058 20,024 017e076aa300 7ff93d333058 20,024 017e076af1a0 7ff93d333058 20,024 017e076b4040 7ff93d333058 20,024 017e076b8ee0 7ff93d333058 20,024 017e076bdd80 7ff93d333058 20,024 017e076c2c20 7ff93d333058 20,024 017e076c7ac0 7ff93d333058 20,024 017e076cc960 7ff93d333058 20,024 017e076d1800 7ff93d333058 20,024 017e076d66a0 7ff93d333058 20,024 017e076db540 7ff93d333058 20,024 017e076e03e0 7ff93d333058 20,024 017e076e5280 7ff93d333058 20,024 017e076ea120 7ff93d333058 20,024 017e076eefc0 7ff93d333058 20,024 017e076f3e60 7ff93d333058 20,024 017e076f8d00 7ff93d333058 20,024 017e076fdba0 7ff93d333058 20,024 017e07702a40 7ff93d333058 20,024 017e077078e0 7ff93d333058 20,024 017e0770c780 7ff93d333058 20,024 017e07711620 7ff93d333058 20,024 017e077164c0 7ff93d333058 20,024You can see that most of them are the same size. And you can see the following statistics:
Statistics:
MT              Count      TotalSize           Class Name
7ff93d333058    55,862     1,11,21,80,222      System.Char[]
Total 55,862 objects, 1,11,21,80,222 bytes
Dump a few of them to find out what they contain.
0:000> !do  017e9a469e08
Name:        System.Char[]
MethodTable: 00007ff93d333058
EEClass:     00007ff93d332fd8
Size:        20024(0x4e38) bytes
Array:       Rank 1, Number of elements 10000, Type Char (Print Array)
Content:     http://blogs.msdn.com/tom.......................................................................................................
Fields:
None
0:000> !do 017e9a464f10
Name:        System.Char[]
MethodTable: 00007ff93d333058
EEClass:     00007ff93d332fd8
Size:        20024(0x4e38) bytes
Array:       Rank 1, Number of elements 10000, Type Char (Print Array)
Content:     http://blogs.msdn.com/jamesche..................................................................................................
Fields:
Now, you need to know why they're not collected.
If you run
gcrooton some of those addresses, and you see a finalizer queue:0:000> !gcroot 017e9a469e08 Finalizer Queue: 000001831657ced0 (finalizer root) -> 017e9a469da0 BuggyBits.Models.Link -> 017e9a469dc0 System.Text.StringBuilder -> 017e9a469e08 System.Char[]Check the finalizer thread to see what it's doing.
Run
!threadsto list all threads and show their states. You see thread 42 has a finalizer:0:000> !threads ThreadCount: 86 UnstartedThread: 0 BackgroundThread: 36 PendingThread: 0 DeadThread: 49 Hosted Runtime: no Lock DBG ID OSID ThreadOBJ State GC Mode GC Alloc Context Domain Count Apt Exception 24 1 7f04 0000017E06A683A0 202a020 Preemptive 0000000000000000:0000000000000000 0000017e06237220 0 MTA 42 2 c588 0000017E06A435C0 202b220 Preemptive 0000000000000000:0000000000000000 0000017e06237220 0 MTA (Finalizer) 44 3 ca94 0000017E06A45BA0 102a220 Preemptive 0000000000000000:0000000000000000 0000017e06237220 0 MTA (Threadpool Worker) XXXX 4 0 0000017E06A448B0 1039820 Preemptive 0000000000000000:0000000000000000 0000017e06237220 0 Ukn (Threadpool Worker) 45 6 7424 0000017E06A45550 8029220 Preemptive 0000000000000000:0000000000000000 0000017e06237220 0 MTA (Threadpool Completion Port) 46 7 ad48 0000017E06A44F00 202b220 Preemptive 0000000000000000:0000000000000000 0000017e06237220 0 MTA 19 11 c1a0 0000018315B92F90 20220 Preemptive 0000000000000000:0000000000000000 0000017e06237220 0 Ukn XXXX 13 0 0000018315B922F0 1039820 Preemptive 0000000000000000:0000000000000000 0000017e06237220 0 Ukn (Threadpool Worker) XXXX 15 0 0000018315B96EB0 1039820 Preemptive 0000000000000000:0000000000000000 0000017e06237220 0 Ukn (Threadpool Worker) XXXX 16 0 0000018315B92940 1039820 Preemptive 0000000000000000:0000000000000000 0000017e06237220 0 Ukn (Threadpool Worker) XXXX 17 0 0000018315B93C30 1039820 Preemptive 0000000000000000:0000000000000000 0000017e06237220 0 Ukn (Threadpool Worker) 15 18 b878 0000018315B94280 20220 Preemptive 0000000000000000:0000000000000000 0000017e06237220 0 Ukn 17 19 9960 0000018315B91000 20220 Preemptive 0000000000000000:0000000000000000 0000017e06237220 0 Ukn 18 20 90cc 0000018315B90360 20220 Preemptive 0000000000000000:0000000000000000 0000017e06237220 0 Ukn XXXX 14 0 0000018315B935E0 1039820 Preemptive 0000000000000000:0000000000000000 0000017e06237220 0 Ukn (Threadpool Worker) XXXX 12 0 0000018315B948D0 1039820 Preemptive 0000000000000000:0000000000000000 0000017e06237220 0 Ukn (Threadpool Worker) XXXX 5 0 0000018315B95570 1039820 Preemptive 0000000000000000:0000000000000000 0000017e06237220 0 Ukn (Threadpool Worker) XXXX 21 0 0000018315B8FD10 1039820 Preemptive 0000000000000000:0000000000000000 0000017e06237220 0 Ukn (Threadpool Worker) XXXX 22 0 0000018315B91650 1039820 Preemptive 0000000000000000:0000000000000000 0000017e06237220 0 Ukn (Threadpool Worker) XXXX 23 0 0000018315B96210 1039820 Preemptive 0000000000000000:0000000000000000 0000017e06237220 0 Ukn (Threadpool Worker) XXXX 24 0 0000018315B909B0 1039820 Preemptive 0000000000000000:0000000000000000 0000017e06237220 0 Ukn (Threadpool Worker) 16 27 6bc 0000018315B95BC0 20220 Preemptive 00000180E160EEF0:00000180E160F250 0000017e06237220 0 Ukn 14 28 c284 0000018315B96860 20220 Preemptive 0000000000000000:0000000000000000 0000017e06237220 0 Ukn XXXX 29 0 0000017E06A461F0 1039820 Preemptive 0000000000000000:0000000000000000 0000017e06237220 0 Ukn (Threadpool Worker) XXXX 30 0 0000018315BC7E90 1039820 Preemptive 0000000000000000:0000000000000000 0000017e06237220 0 Ukn (Threadpool Worker) XXXX 31 0 0000018315BC7840 1039820 Preemptive 0000000000000000:0000000000000000 0000017e06237220 0 Ukn (Threadpool Worker) XXXX 32 0 0000018315BC6BA0 1039820 Preemptive 0000000000000000:0000000000000000 0000017e06237220 0 Ukn (Threadpool Worker) XXXX 34 0 0000018315BC6550 1039820 Preemptive 0000000000000000:0000000000000000 0000017e06237220 0 Ukn (Threadpool Worker) XXXX 38 0 0000018315BC58B0 1039820 Preemptive 0000000000000000:0000000000000000 0000017e06237220 0 Ukn (Threadpool Worker) XXXX 39 0 0000018315BC84E0 1039820 Preemptive 0000000000000000:0000000000000000 0000017e06237220 0 Ukn (Threadpool Worker) XXXX 40 0 0000018315BC1990 1039820 Preemptive 0000000000000000:0000000000000000 0000017e06237220 0 Ukn (Threadpool Worker) 7 41 c4cc 0000018315BC5F00 20220 Preemptive 0000000000000000:0000000000000000 0000017e06237220 0 Ukn XXXX 42 0 0000018315BC1FE0 1039820 Preemptive 0000000000000000:0000000000000000 0000017e06237220 0 Ukn (Threadpool Worker) XXXX 43 0 0000018315BC2630 1039820 Preemptive 0000000000000000:0000000000000000 0000017e06237220 0 Ukn (Threadpool Worker) XXXX 44 0 0000018315BC2C80 1039820 Preemptive 0000000000000000:0000000000000000 0000017e06237220 0 Ukn (Threadpool Worker) 9 48 b838 0000018315BC45C0 20220 Preemptive 0000017EE1D45B38:0000017EE1D45FD0 0000017e06237220 0 Ukn 5 49 a40 0000018315BC4C10 20220 Preemptive 0000000000000000:0000000000000000 0000017e06237220 0 Ukn XXXX 50 0 0000018315D0AA30 1039820 Preemptive 0000000000000000:0000000000000000 0000017e06237220 0 Ukn (Threadpool Worker) XXXX 51 0 0000018315D06B10 1039820 Preemptive 0000000000000000:0000000000000000 0000017e06237220 0 Ukn (Threadpool Worker) XXXX 52 0 0000018315D0C370 1039820 Preemptive 0000000000000000:0000000000000000 0000017e06237220 0 Ukn (Threadpool Worker) 8 53 7024 0000018315D05820 20220 Preemptive 0000000000000000:0000000000000000 0000017e06237220 0 Ukn XXXX 54 0 0000018315D077B0 1039820 Preemptive 0000000000000000:0000000000000000 0000017e06237220 0 Ukn (Threadpool Worker) 11 55 7068 0000018315D05E70 20220 Preemptive 0000000000000000:0000000000000000 0000017e06237220 0 Ukn 10 56 c0ac 0000018315D090F0 20220 Preemptive 0000000000000000:0000000000000000 0000017e06237220 0 Ukn XXXX 63 0 00000183158CA200 1039820 Preemptive 0000000000000000:0000000000000000 0000017e06237220 0 Ukn (Threadpool Worker) 4 64 83d0 00000183158CAEA0 20220 Preemptive 0000018121307DF8:0000018121307FD0 0000017e06237220 0 Ukn 6 65 beb4 0000018315894860 20220 Preemptive 0000000000000000:0000000000000000 0000017e06237220 0 Ukn 48 66 cad4 0000018315D0B6D0 21220 Preemptive 0000000000000000:0000000000000000 0000017e06237220 0 Ukn 49 67 94f8 0000018315D0A3E0 21220 Preemptive 0000000000000000:0000000000000000 0000017e06237220 0 UknDump thread 42 and check the stack, and then you see
buggybits.models.linkcalling some Thread.Sleep:0:042> k *** WARNING: Unable to verify checksum for BuggyBits.dll # Child-SP RetAddr Call Site 00 00000027`987ff4e8 00007ffa`98245683 ntdll!NtDelayExecution+0x14 01 00000027`987ff4f0 00007ffa`9593993d ntdll!RtlDelayExecution+0x43 02 00000027`987ff520 00007ff9`9cce7404 KERNELBASE!SleepEx+0x7d 03 (Inline Function) --------`-------- coreclr!EESleepEx+0xd 04 00000027`987ff5a0 00007ff9`9cce72ed coreclr!Thread::UserSleep+0xbc 05 00000027`987ff600 00007ff9`9c7ec46b coreclr!ThreadNative::Sleep+0xad 06 00000027`987ff750 00007ff9`3ddd6eac System_Private_CoreLib!System.Threading.Thread.Sleep+0xb 07 00000027`987ff780 00007ff9`9cd86c16 BuggyBits!BuggyBits.Models.Link.Finalize+0x1c 08 00000027`987ff7c0 00007ff9`9cd28bf7 coreclr!FastCallFinalizeWorker+0x6 09 00000027`987ff7f0 00007ff9`9cd28ad2 coreclr!MethodTable::CallFinalizer+0x97 0a (Inline Function) --------`-------- coreclr!CallFinalizer+0x3d 0b (Inline Function) --------`-------- coreclr!FinalizerThread::DoOneFinalization+0x3d 0c 00000027`987ff830 00007ff9`9cd284f7 coreclr!FinalizerThread::FinalizeAllObjects+0xda 0d 00000027`987ff920 00007ff9`9cd293c2 coreclr!FinalizerThread::FinalizerThreadWorker+0x97 0e (Inline Function) --------`-------- coreclr!ManagedThreadBase_DispatchInner+0xd 0f 00000027`987ff960 00007ff9`9cd292af coreclr!ManagedThreadBase_DispatchMiddle+0x7e 10 00000027`987ffa80 00007ff9`9cc85f3a coreclr!ManagedThreadBase_DispatchOuter+0xaf 11 (Inline Function) --------`-------- coreclr!ManagedThreadBase_NoADTransition+0x28 12 (Inline Function) --------`-------- coreclr!ManagedThreadBase::FinalizerBase+0x28 13 00000027`987ffb20 00007ff9`9cd734ca coreclr!FinalizerThread::FinalizerThreadStart+0x7a 14 00000027`987ffc40 00007ffa`9725257d coreclr!Thread::intermediateThreadProc+0x8a 15 00000027`987ffd00 00007ffa`9824af28 kernel32!BaseThreadInitThunk+0x1d 16 00000027`987ffd30 00000000`00000000 ntdll!RtlUserThreadStart+0x28Check the following code snippet in the Link.cs file, and you'll see that there's an explicit call to
Thread.Sleep, which is causing high memory usage.Note
As mentioned earlier in the article,
BuggyBitsand the following code snippet are specific to the sample application used to create this example.Check your application code if you come across a similar scenario and found a specific method in your application that's causing high memory issue based on the dump analysis.// BuggyBits.Models.Link // Flags = reuse slot, hide by signature protected override void Finalize() { try { System.Threading.Thread.Sleep(5000); } finally { base.Finalize(); } return; }