Note
Access to this page requires authorization. You can try signing in or changing directories.
Access to this page requires authorization. You can try changing directories.
Note
This article is included in a 3-part series. You can review Part 2: TCP/IP performance underlying network issues and Part 3: TCP/IP performance known issues.
Transmission Control Protocol/Internet Protocol (TCP/IP) performance is a comparison. The comparison should be conducted with identical endpoints in terms of hardware, network path, and Operating System (OS). Real-life performance is different because multiple factors are involved and may cause a bottleneck. These factors are often the underlying network, the design of TCP and the actual transmit rate of storage IOs.
Read more about performance tuning to set the best performing configuration for the endpoints.
TCP receive window autotuning is an application defined feature used for scaling up the connection to utilize the bandwidth in high latency networks. For example, if the TCP is configured to use autotuning level to normal and if the application has enough buffer defined for TCP window, then the OS will scale the TCP to maximum quickly. However, this feature is designed for higher latency networks. For low latency networks, there is no such requirement as there won't be many segments on the fly (for example, on the network infra).
For high latency networks with a TCP window that isn't scaled to maximum at once, there are algorithms such as CUBIC, NewReno, and Compound TCP to determine the bandwidth-delay product (BDP) and scale the window accordingly. Windows OS assigns a congestion algorithm to each socket created.
TCP settings are predefined in Windows 10. Use the Get-NetTCPSettings cmdlet to get the TCP settings and use the Get-NetTCPConnection cmdlet to view the TCP connection properties, such as local or remote IP address, local or remote port, and connection state.
Here are tips to enhance the throughput:
- Make sure there are no underlying network issues (packet loss).
- Enable advanced properties of NIC for performance features (such as Jumbo frames, RSS/VMQ, offload features, and RSC), except if there's an underlying network compatibility issue or for troubleshooting purpose.
- Make sure the TCP is configured to use autotuning level to normal.
- Use Performance Monitor analysis to make sure there's no CPU or storage bottleneck.
- Select security features based on the actual organizations' requirements.
- Create a baseline.
Testing tool for TCP throughput
To attain the highest possible throughput for a certain hardware, you must tune the performance factors. Make sure there's no underlying network issues (packet loss). Use the NTttcp.exe or ctsTraffic.exe tool to test the throughput. Refer to Performance Tools for Network Workloads.
Bottlenecks for TCP throughput
Don't use network monitor or take network packet level logs during TCP throughput tests. The Network Driver Interface Specification (NDIS) monitoring filters add a delay for the sender and the receivers each time a packet is recorded. This operation demands CPU resources and generates many storage IOs. Performance decreases when packet level logs are taken because the TCP is trying to recover from packet loss.
Adding security has its own cost and performance issues. Security protocols such as Internet Protocol Security (IPsec) has overhead and extra processing requirements. Comparing data protection with data integrity, IPsec's integrity mode should be preferred for less processing cost. Security software has a huge cost on packet processing too, which will cause slower outputs.
If the tested performance doesn't come up to expectations, take logs as defined in Network-Related Performance Counters.
After checking for TCP performance issues, check upper layer associated protocols such as file system protocols (Server Message Block (SMB) or Network File System (NFS)). These protocols require processor resources and disk IOs. The slow speed is caused by a faulty driver or hardware, a high deferred procedure call (DPC) queue or/and slow disk IOs. Finding out which component in the OS is causing high DPCs is challenging because that requires an analysis using Xperf/Windows Performance Recorder (WPR) (CPU) logging. Finding disk-related slowness issues is comparatively easier. For more information, see Examining and Tuning Disk Performance.
During the test, testing applications (client and server applications) can be adjusted to use multiple threads with buffer values high enough to reach the maximum throughput. However, that might not reflect the actual conditions because the number of threads and buffer each API call can utilize is limited based on the programming. In addition, application layer protocol (SMB or Common Internet File System (CIFS)) has its own buffer and optimization (Performance Tuning for file Servers or SMB: Troubleshooting Guide). If the application doesn't work as expected for baseline, work with an application specialist to find the bottleneck.
How to create a baseline
A baseline of performance must be created to compare current throughput. To better understand the network, create the baseline at the beginning of the deployment.
A baseline is formed by the following major points:
- Source and destination networks
- Latency and hop count between these networks
- Processor/interface capability and configuration
- Time frame of the tests (working hours/non-working hours/peak hours)
- OS versions
- Throughput pull and throughput push
Note
Create the baseline with the same server models (same number of NIC cards and processor capacity) to keep the processing power nearly equal.
Watch the buffer and keep track of the number of transport sessions created by testing tools. Four simultaneous TCP transport sessions can evaluate utilizing CPU evenly with RSS being enabled.
Here are the steps to measure throughput and create a baseline:
Download the ctsTraffic tool. Here's a description of some parameters of the ctsTraffic tool.
Parameter Description -listen:<IP/*>This option is used for port listening on servers. If *is specified, the ctsTraffic tool listens on all the IP addresses available on that machine. For example,-listen:*.-target:<IP>This option is used on clients, and it specifies the IP address of the server on which ctsTraffic.exe is running and is in listening state. For example, -target:192.168.1.10.-pattern:pullThe CtsTraffic tool use Push pattern by default. That means data is sent from the client to the server. When this switch is used on both the client and the server, the data is received on the client. Don't use this option when performing a Push test. -connections:<num>This option specifies the number of the TCP connections. TCP sockets will be created from the client simultaneously. Eight is commonly used as the RSS queues on midlevel network cards are 8. For example, -connections:8.-iterations:<num>This option specifies the multiplied number of connections in -connections:. For example,-iterations:10. With 10 iterations, the client will attempt 80 connections in total. If this option isn't specified, the client will continue to attempt 8 connections until 1000 connections.-statusfilename:<filename.csc>Use this option to flush the console level 1 option to a .txtfile compatible with Microsoft Excel.-connectionfilename:<filename.csv>Use this option to flush verbose details. For example, socket level information such as the time taken by each socket to transfer the data. You can check if there are any errors or advanced troubleshooting with this option. -consoleverbosity:<0|1|2|3>This option specifies the view or the output on the monitor while the test is running. For example, -consoleverbosity:1.Open Resource Monitor on the receiving side. For example, if you use
-pattern:pull, open it on the client, otherwise open it on the server.Start the ctsTraffic tool on the server and run the following command:
Ctstraffic.exe -listen:* -consoleverbosity:1 <-pattern:pull>
Start the ctsTraffic tool on the client and run the following command:
Ctstraffic.exe -target:<serverip> -consoleverbosity:1 <-pattern:pull> -connections:8 -iterations:10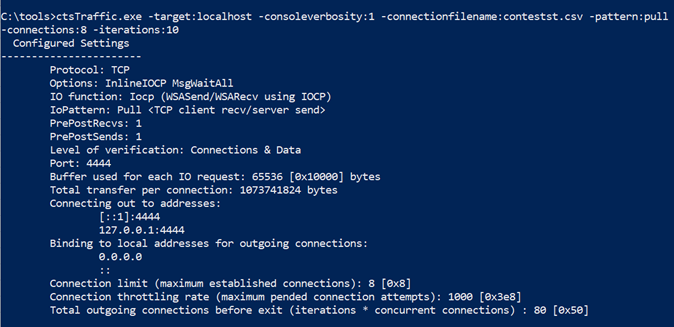
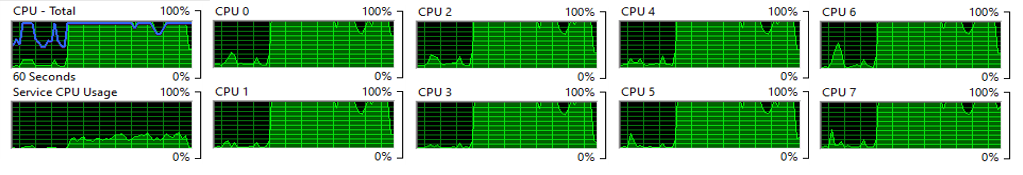
Make sure the processors of the receiving side are utilized evenly. If they aren't, check the issue with RSS to find out which one doesn't work as expected.
Calculate the throughput in bits/second according to the result on the client. Refer to the example in the following screenshot:

In this example, the throughput is almost 19 Gb/s and is calculated as follows:
(85,899,349,200 bytes/36.678 seconds) * 8 = 18,735,885,097.33355 (bits/second)