Note
Access to this page requires authorization. You can try signing in or changing directories.
Access to this page requires authorization. You can try changing directories.
Note
This article is included in a 3-part series. You can review Part 1: TCP/IP performance overview and Part 2: TCP/IP performance underlying network issues.
This article describes the following TCP/IP performance issues:
- Slow throughput on high latency and high bandwidth network
- Slow throughput on low latency and high bandwidth network
- Underlying network issues
Slow throughput speed on a high latency and bandwidth network
Two servers located in different sites are connected over a high latency network. The throughput measured with the ctsTraffic tool is lower than the baseline.
That's because the TCP Window Scale option isn't enabled on either server. Use Windows Command Prompt or Windows PowerShell to enable the option by setting the TCP receive window autotuning level.
Use Command Prompt to enable the autotuning level
Run the following command:
netsh int tcp set global autotuninglevel=normal
To check if the autotuning level is enabled, use the following command:
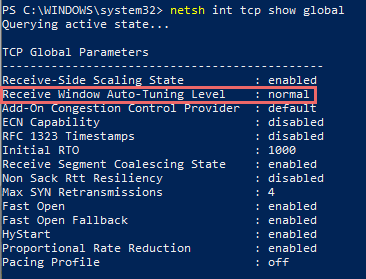
netsh int tcp show global
Use PowerShell to enable the autotuning level
Run the following cmdlet:
Get-NetTCPSetting | Set-NetTCPSetting -AutoTuningLevelLocal Normal
To check if the autotuning level is enabled, use the following cmdlet:
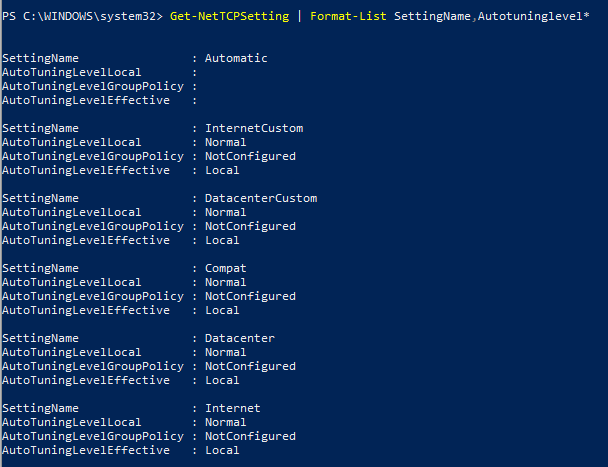
Get-NetTCPSetting | Format-List SettingName,Autotuninglevel*
Note
There are five levels for receive window autotuning: Disabled, Highly Restricted, Restricted, Normal, and Experimental. For more information about how autotuning affects the throughput, see Performance Tuning Network Adapters.
Slow throughput speed on a low latency and high bandwidth network
Two servers are connected on a same network that has low latency and high bandwidth. When you create a baseline or test TCP performance with the ctsTraffic tool, only CPU 0 spikes in a multi-core CPU server.
This issue occurs because the Receive Side Scaling (RSS) or Virtual Machine Queue (VMQ) feature isn't enabled or isn't configured correctly. Use VMQ when the physical machine is a hypervisor. If it isn't, enable RSS on both the Operating System (OS) and on the network cards.
Note
Wireless network cards don't support RSS or VMQ features.
Enable RSS for OS
Enable RSS by using Command Prompt or PowerShell as follows:
Command Prompt: netsh int tcp set global rss=enabled
PowerShell: Set-NetAdapterRss -Name <interface name> -Enabled $True
Enable RSS for network cards
First, check if the RSS feature is enabled. Check the network card advanced properties for the related configuration by using the following cmdlet:
Get-NetAdapterAdvancedProperty | Where-Object -property RegistryKeyword -Like *rss* | format-table -AutoSize
Note
Changes to the advanced properties may result in interruption or loss of network connectivity. Before making the changes, refer to the NIC vendor documentation.
Follow these steps to enable RSS for network cards:
- Run
ncpa.cplto open Network Connections. - Right-click the targeted connection, and then select Properties > Configure.
- Under the Advanced tab, locate Receive Side Scaling in the Property list and then set the Value to Enable.
- Select OK.
RSS can also be enabled by using the PowerShell cmdlet:
Set-NetAdapterAdvancedProperty -Name <Interface name> -RegistryKeyword *RSS -RegistryValue 1
Underlying network issues
This section describes how to check for underlying network issues while measuring a throughput baseline or troubleshooting throughput issues.
To get a packet level log analysis, check underlying network issues by using a network packet capturing tool (such as Microsoft Network Monitor, Wireshark, or ctsTraffic).
Steps to take logs with network packet capturing tools
Start logging with Microsoft Network Monitor or Wireshark to capture traffic on both endpoints. You can also use the Windows built-in capturing tool as follows:
Open Command Prompt as an administrator.
Run the following command:
NETSH TRACE START CAPTURE=YES REPORT=DISABLED TRACEFILE=<FILEPATH>.ETL MAXSIZE=512Note
Multiple captures might be required while using the
netsh tracecommand.
Run the CTStraffic.exe tool to generate a .csv file.
Stop the logging. For Windows built-in capturing tool, type
NETSH TRACE STOPin Command Prompt as an administrator.
Analyze the capture file
Here's an example showing how to analyze a filtered result. In this scenario, the ctsTraffic tool uses the push pattern (the default pattern), which means the packet is sent from the client to the server.
Open the capture file in Microsoft Network Monitor.
Filter the network trace by using the
Property.TCPRetransmit==1 && tcp.Port==4444filter, which locates the retransmission packets. A packet retransmission means that a TCP acknowledgment of the given TCP sequence from the sender is never received.Note
To analyze an ETL file, go to Tools > Options > Parser Profiles > Windows > Set As Active > OK.
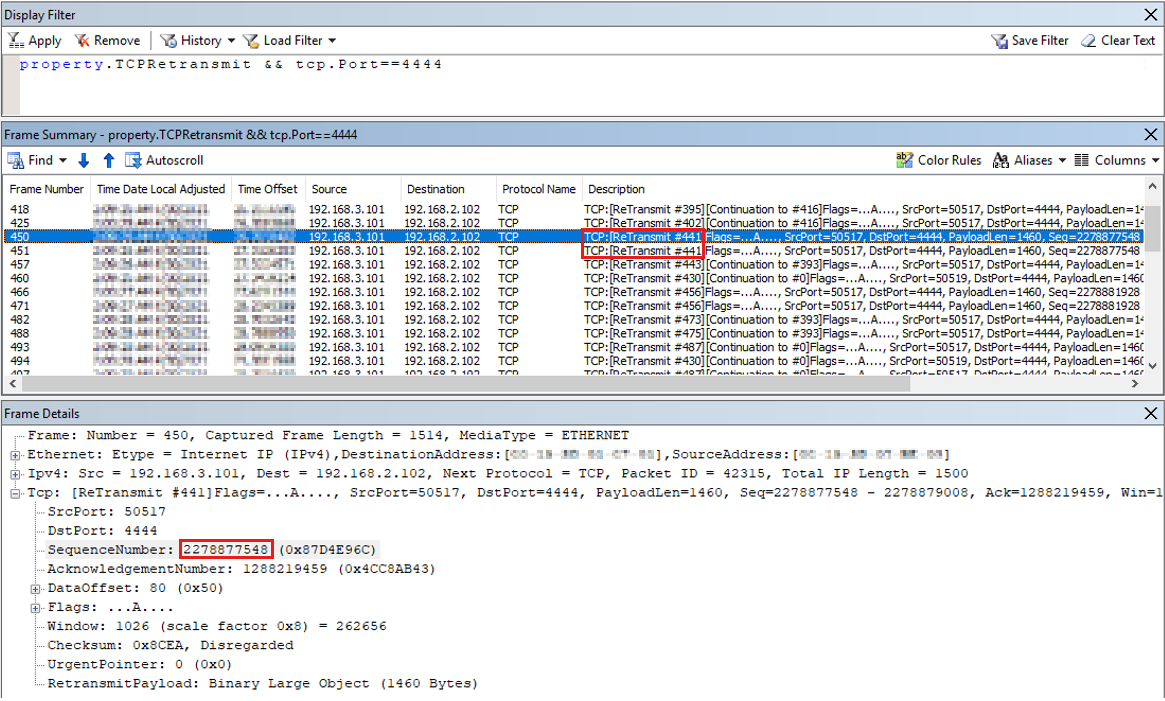
As shown in the screenshot, frame
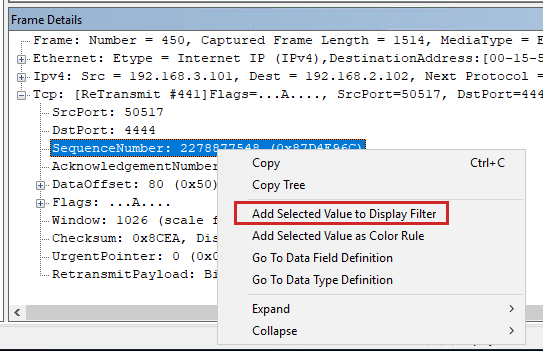
#441is retransmitted twice, which means it is transmitted by the sender three times. Use the same TCP sequence number (2278877548) to identify this frame.Right-click the SequenceNumber in Frame Details and select Add Selected Value to Display Filter.
Disable the previous filter by adding "//" as follows:
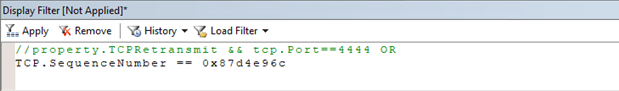
Select Apply. The complete TCP sequence with this sequence number is displayed as follows:
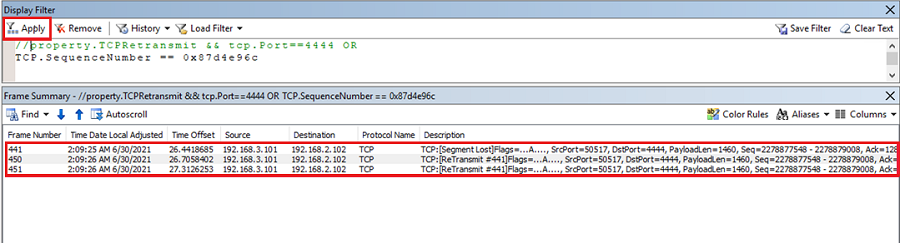
This result shows that the original frame
#441isn't received by the server and is retransmitted by the sender. The retransmission of a frame happens if no acknowledgment of the sequence is received. To understand how TCP works, see The three-way handshake via TCP/IP and Description of Windows TCP features. Then, copy theTCP.SequenceNumber == <value>sequence filter from the client trace and paste it on the server trace.On the server, only one packet of the given sequence is received, as shown in the following result:
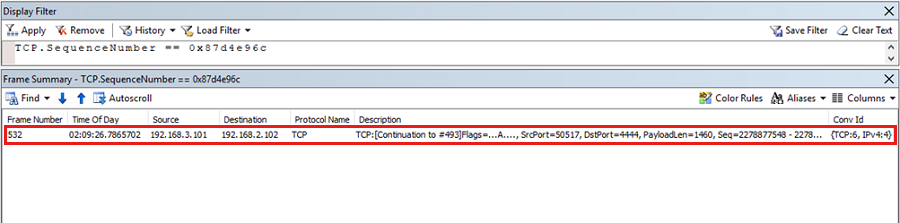
This result proves that there is packet loss from the sender to the receiver on the intermediate network devices. The packets leave the sender but never reach the receiver. It is an issue with underlying networking and it should be resolved by network administrators.
TCP Loopback Performance
With the Release of Windows Server 2019, the TCP/IP loopback processing model has been changed in order to address certain performance bottlenecks which existed in previous windows releases. This section describes the configuration options available to change the behavior of TCP/IP loopback processing.
The configuration parameters are available through the netsh configuration tool. Each setting can be set individually for IPv4 and IPv6. The default values might vary from different Windows versions.
Note
On general purpose Windows computers, the default values should not be changed.
If a application developer determines that the loopback data path is the root cause for the applications insufficient performance, the following commands can be used to tailor the configuration towards the individual needs of the application.
netsh int ipv6|ipv4 set gl loopbackexecutionmode=adaptive|inline|worker
netsh int ipv6|ipv4 set gl loopbackworkercount=<value>
netsh int ipv6|ipv4 set gl loopbacklargemtu=enable|disable
Explanation
Loopbackexecutionmode
Worker
In this mode, packets are queued on the sender side and processed by a worker thread on the receiver side. This mode favors throughput over latency.
Inline
In this mode, processing is done in context of application threads both on sender and receiver side. This mode favors latency over throughput.
Adaptive
First packets of the data flow are processing inline, and then packets are deferred to worker threads. This mode tries to balance latency and throughput.
Loopbackworkercount
Allows to configure the number of worker threads been used.
Loopbacklargemtu
Allows to configure the use of large MTU, this should be enabled.