Note
Access to this page requires authorization. You can try signing in or changing directories.
Access to this page requires authorization. You can try changing directories.
This article helps troubleshoot issues using Performance Monitor.
What is Performance Monitor (perfmon)?
Having been available in various iterations since the early days of Windows, Performance Monitor is an MMC snap-in in Windows that helps monitor system usage and various performance metrics. The default view upon opening shows a few different areas and real-time metrics, which include:
- Performance Monitor: Real-time viewing of metrics
- Data Collector Sets: Defined data collection within a given time interval
- Reports: The data collected in the Data Collector Sets
Questions before data collection
Once you encounter issues, find out more information about what happened before any troubleshooting and data collection.
- What kind of issue?
- Can this issue be reproduced?
- Does the issue happen sporadically? If so, what actions did the user take?
- Is there a pattern observed? If so, what kind of pattern?
- Does it happen only once and not occur again?
For example, you encounter a high CPU usage issue sporadically. Sometimes, this issue happens five minutes after the system starts, sometimes after two hours, and so on. No pattern is observed. When you look up Task Manager or other monitoring tools, you can't observe it, or you're not sure whether the output from the monitoring tools shows what's happening.
In this situation, you need a general overview of the system resources. This can be achieved with a long-running Performance Monitor.
Note
Performance Monitor has no access to the kernel and doesn't log such information. Also, Performance Monitor is lightweight compared to other logging tools for high CPU usage issues, and it's a built-in tool. You can run Performance Monitor locally or remotely.
Run Performance Monitor locally
You can add counters as needed. Open an elevated command prompt and run the following commands:
Create a data collector set:
Logman.exe create counter CORE_%computername% -f bin -v mmddhhmm -max 2048 -c "\Memory\*" "\Cache\*" "\Objects\*" "\Network Interface(*)\*" "\Paging File(*)\*" "\PhysicalDisk(*)\*" "\LogicalDisk(*)\*" "\Processor(*)\*" "\Processor Information(*)\*" "\Process(*)\*" "\Server\*" "\System\*" "\Server Work Queues(*)\*" "\Terminal Services\*" "\Terminal Services Session(*)\*" -si 00:00:01Note
-max 2048means the maximum log file size is 2 GB.-si 00:00:01means the interval is1second. You can change this setting based on your needs.Start the data collector set:
logman start CORE_%computername%Stop the trace that will be stored under c:\perflogs\Admin:
logman stop CORE_%computername%
Run Performance Monitor remotely
To set up Performance Monitor to monitor the remote system, open an elevated command prompt and run the following commands:
Create a data collector set:
Logman create counter <LOGNAME> -u <DOMAIN\USERNAME> * -f bincirc -v mmddhhmm -max 500 -c "\\<SERVERNAME>\LogicalDisk(*)\*" "\\<SERVERNAME>\Memory\*" "\\<SERVERNAME>\Network Interface(*)\*" "\\<SERVERNAME>\Paging File(*)\*" "\\<SERVERNAME>\PhysicalDisk(*)\*" "\\<SERVERNAME>\Process(*)\*" "\\<SERVERNAME>\Redirector\*" "\\<SERVERNAME>\Server\*" "\\<SERVERNAME>\System\*" "\\<SERVERNAME>\Terminal Services\*" "\\<SERVERNAME>\Processor(*)\*" "\\<SERVERNAME>\Cache\*" -si 00:00:02Note
Replace <DOMAIN\USERNAME> with the respective user credentials and <SERVERNAME> with the name of the problematic server.
Start the data collector by running the following command:
logman start <LOGNAME>Once the server stops responding, stop the data collector by running the following command:
logman stop <LOGNAME>
The Performance Monitor log will be located in the C:\PERFLOGS folder. Then, zip the .blg file and upload it to the workspace after the issue occurs.
After running Performance Monitor for one or two working days, you can analyze the log to see if any patterns exist. Which processes spike the CPU? And, are the processes the same or different each day or hour?
Based on the findings, go further to the next steps to find out more about what causes them to spike the CPU. Identify the root cause by tracing the sequence of processes, threads, modules, and functions.
Troubleshooting examples
See the following examples of using TroubleShootingScript (TSS) to collect data and CpuStres to simulate CPU activity.
Using TSS
TSS can get a high CPU usage trace when the CPU hits a certain threshold:
Download TSS and extract it to the C:\tss folder on the affected computer.
From an elevated PowerShell command prompt, run the following cmdlet from the C:\tss folder.
.\TSS.ps1 -perfmon general -WaitEvent HighCPU:90 -StopWaitTimeInSec 100Note
Wait for the high CPU usage issue to occur. Once the CPU usage exceeds <CpuThreshold>%, keep collecting data for a duration of
StopWaitTimeInSecsettconds (the default value is 60).Here are more examples:
-
.\TSS.ps1 -PerfMon General -PerfIntervalSec 5 -WaitEvent HighCPU:90PerfMonrepresents Performance Monitor with a short interval. -
.\TSS.ps1 -PerfMonLong SMB -PerfLongIntervalMin 11 -WaitEvent HighCPU:90PerfMonLongrepresents Performance Monitor with a long interval.
-
From a new elevated PowerShell command prompt, run the following cmdlet from the C:\tss folder.
.\TSS.ps1 -StopNote
If the trace doesn't stop after five minutes, stop it.
TSS supports performance monitors. You can see detailed performance counter names by running the .\TSS.ps1 -ListSupportedPerfCounter cmdlet.
Start capturing performance counters with the General counter set by running the cmdlet:
.\TSS.ps1 -PerfMon General
If you want to change the interval for the performance log, use -PerfIntervalSec (the unit is second) or -PerfIntervalMin (the unit is minute). For example, .\TSS.ps1 -PerfMon General -PerfIntervalSec 1 specifies an interval of one second.
Here are more examples of the .\TSS.ps1 -PerfMon <CounterSetName> cmdlet:
Start Performance Monitor with general counters (CPU, memory, disk, and so on) and a 5-second interval:
.\TSS.ps1 -PerfMon General -PerfIntervalSec 5Start Performance Monitor (
Long) with SMB counters (SMB counters and general counters) and an 11-minute interval:.\TSS.ps1 PerfMonLong SMB -PerfLongIntervalMin 11
You can also do this with Performance Monitor to start tracing when the CPU usage hits a certain amount, but it's complicated and time-consuming.
Using CpuStres
You can use CpuStres to simulate a high CPU usage activity by running several threads. After tracing the high CPU usage issue for six minutes, Performance Monitor shows gaps in the following graph, which is an issue:
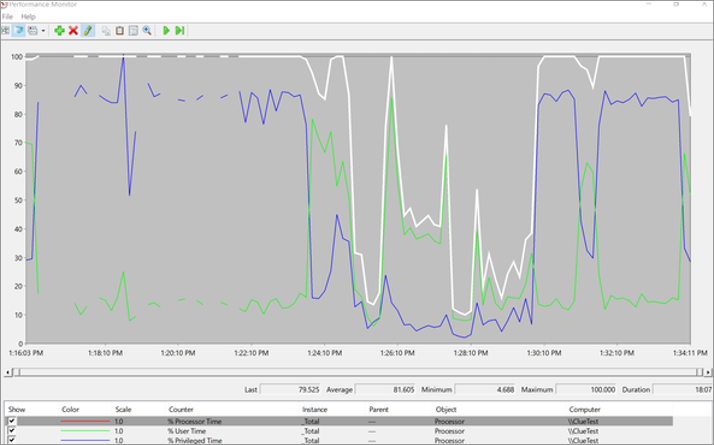
| Processor | Minimum | Maximum | Average |
|---|---|---|---|
| % Processor Time | 4.688% | 100% | 81.605% |
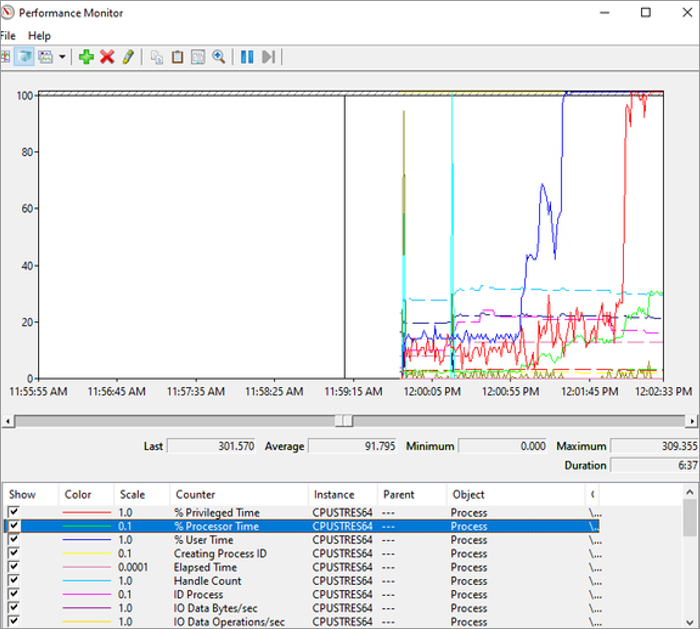
When you add counters for Processor: %ProcessorTime and look at the instances, you see that CPUStres64.exe has the highest consumption. There are instances where the %Processor Time exceeded 100%, reaching approximately 180% in the data, indicating significant spikes.

| % Processor Time | Minimum | Maximum | Average |
|---|---|---|---|
| CPUSTRES64 | 0% | 180.309% | 19.787% |
Check the Processor Queue Length, the average of which is > 10. This is an issue. Drill down into who's using the %Processor Time.
This is a limitation of Performance Monitor. It can only show so much data.
Performance counters for CPU usage
For high CPU usage issues, first check the CPU usage in Task Manager. If the CPU utilization continuously exceeds 85%, it indicates the system is facing a CPU bottleneck. Here's the list of counters that need to be checked:
- Processor: % Processor Time
- Processor: % User Time
- Processor: % Privilege Time
- Processor: % Interrupt Time
- System: Processor Queue Length
- System: Calls/sec
- System: Context Switches/sec
- Process: Thread Count
- Process: Handle Count
Look at the following counters that are monitored for different performance aspects:
| Component | Performance aspect being monitored | Counters to monitor |
|---|---|---|
| Processor | Usage | Processor: % Processor Time (all instances) Processor: % DPC Time Processor: % Interrupt Time Processor: % Privileged Time Processor: % User Time |
| Processor | Bottlenecks | Processor: % Processor Time (all instances) Processor: % DPC Time Processor: % Interrupt Time Processor: % Privileged Time Processor: % User Time Processor: Interrupts/sec Processor: DPCs Queued/sec System: Context switches/sec System: System Calls/sec System: Processor Queue Length (all instances) |
| Counter name | Metric |
|---|---|
| Processor Queue Length (PQL) | If there are two or more instances per processor and the CPU usage is high, check processes for high CPU consumption. Also, check Context Switches, % DPC Time, and % Interrupt Time. |
| % Processor Time | 0-50%: healthy. 50-80%: monitor/warning monitor. 80-100%: critical. The system might work slowly. |
| % DPC Time | % Processor Time > 85% and % DPC Time > 15%: investigate if they're constantly above these levels. Short spikes are okay. For example, only on one processor with 100% % Processor Time and more than 50% % DPC Time. |
| % Interrupt Time | High CPU interrupt time: more than 30% interrupt time. A high amount of % Interrupt Time in the processor might indicate a hardware or driver problem. Very high CPU interrupt time: more than 50% interrupt time. A very high amount of % Interrupt Time in the processor might indicate a hardware or driver problem. |
References
- Windows Performance Monitor
- LOGMAN (perfmon)
- How to: Use Performance Monitor to Collect Event Trace Data
- User Mode Versus Privileged Mode Processor Usage
Third-party information and solution disclaimer
The information and the solution in this document represents the current view of Microsoft Corporation on these issues as of the date of publication. This solution is available through Microsoft or through a third-party provider. Microsoft does not specifically recommend any third-party provider or third-party solution that this article might describe. There might also be other third-party providers or third-party solutions that this article does not describe. Because Microsoft must respond to changing market conditions, this information should not be interpreted to be a commitment by Microsoft. Microsoft cannot guarantee or endorse the accuracy of any information or of any solution that is presented by Microsoft or by any mentioned third-party provider.
Microsoft makes no warranties and excludes all representations, warranties, and conditions whether express, implied, or statutory. These conditions include but are not limited to representations, warranties, or conditions of title, non-infringement, satisfactory condition, merchantability, and fitness for a particular purpose, regarding any service, solution, product, or any other materials or information. In no event will Microsoft be liable for any third-party solution that this article mentions.