Note
Access to this page requires authorization. You can try signing in or changing directories.
Access to this page requires authorization. You can try changing directories.
The Visual Studio debugger provides many powerful features to help you debug your apps. This article provides a quick way to learn some of the basic features.
Create a new project
Open Visual Studio.
If the start window is not open, choose File > Start Window.
On the start window, choose Create a new project.
On the Create a new project window, enter or type web app in the search box. Next, choose C# from the Language list. Select the ASP.NET Core Web App (Razor Pages) template and follow steps to create the project.
If you don't see the ASP.NET Core Web App (Razor Pages) project template, go to Tools > Get Tools and Features..., which opens the Visual Studio Installer. Choose the ASP.NET and web development workload, then choose Modify.
Visual Studio creates the project.
In Solution Explorer, open Privacy.cshtml (under Pages) and replace the following code:
@{
 ViewData["Title"] = "Privacy Policy";
}
with this code:
@{
 ViewData["Title"] = "Privacy Policy";
 <label>@PrivacyModel.PrivacyMessage</label>
}
In Solution Explorer, open Privacy.cshtml.cs (under Pages/Privacy.cshtml) and replace the following code.
public void OnGet()
{
}
with this code:
public static string? PrivacyMessage { get; set; }

public void OnGet()
{
   LinkedList<int> result = DoWork();
   PrivacyMessage = "Result of work: " + result.First.Value + ", " + result.First.Value;
}

private static LinkedList<int> DoWork()
{
   LinkedList<int> c1 = new();

   c1.AddLast(10);
   c1.AddLast(20);

   LinkedList<int> c2 = new(c1);

   return c2;

}
Set a breakpoint
A breakpoint is a marker that indicates where Visual Studio should suspend your running code so you can take a look at the values of variables, or the behavior of memory, or whether or not a branch of code is getting run. It's the most basic feature in debugging.
To set the breakpoint, click in the gutter to the left of the
DoWorkfunction (or select the line of code and press F9).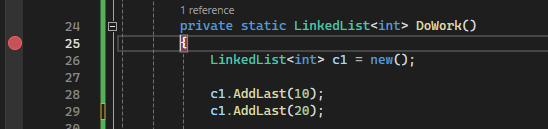
The breakpoint is set to the left of the opening brace (
{).Now press F5 (or choose Debug > Start Debugging).
When the web page loads, select the Privacy link at the top of the web page.
The debugger pauses where you set the breakpoint. A yellow arrow identifies the statement where the debugger and app execution is paused. The line with the opening brace (
{) after theDoWorkfunction declaration hasn't yet executed.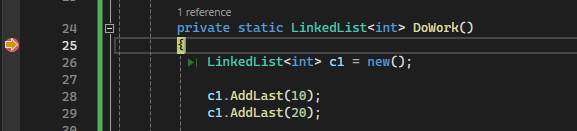
Tip
If you have a breakpoint in a loop or recursion, or if you have many breakpoints that you frequently step through, use a conditional breakpoint to make sure that your code is suspended ONLY when specific conditions are met. This saves time and can also make it easier to debug issues that are hard to reproduce.
Navigate code
There are different commands to instruct the debugger to continue. We show a useful code navigation command that is available starting in Visual Studio 2017.
While the code is paused at the breakpoint, hover over the statement return c2 until the green Run to click button  appears, and then press the Run to click button.
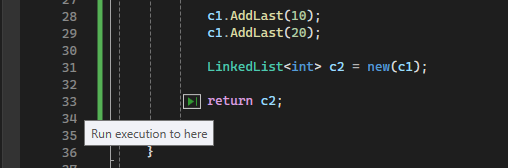
The app continues execution, and pauses on the line of code where you clicked the button.
Common keyboard commands used to step through code include F10 and F11. For more in-depth instructions, see First look at the debugger.
Inspect variables in a datatip
In the current line of code (marked by the yellow execution pointer), hover over the
c2object with your mouse to show a datatip.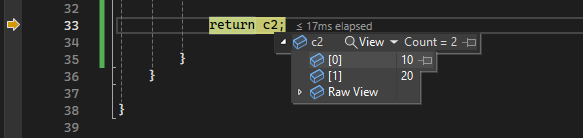
The datatip shows you the current value of the
c2variable and allows you to inspect its properties. When debugging, if you see a value you don't expect, you probably have a bug in the preceding or calling lines of code.Expand the datatip to look at the current property values of the
c2object.If you want to pin the datatip so that you can continue to see the value of
c2while you execute code, select the small pin icon. (You can move the pinned datatip to a convenient location.)
Next steps
In this tutorial, you've learned how to start the debugger, step through code, and inspect variables. You might want to get a high-level look at debugger features along with links to more information.