Note
Access to this page requires authorization. You can try signing in or changing directories.
Access to this page requires authorization. You can try changing directories.
You can debug JavaScript and TypeScript code using Visual Studio. You can hit breakpoints, attach the debugger, inspect variables, view the call stack, and use other debugging features.
Tip
If you haven't already installed Visual Studio, go to the Visual Studio downloads page to install it for free.
Configure debugging
For .esproj projects in Visual Studio 2022, Visual Studio Code uses a launch.json file to configure and customize the debugger. launch.json is a debugger configuration file.
Visual Studio attaches the debugger only to user code. For .esproj projects, you can configure user code (also called Just My Code settings) in Visual Studio using the skipFiles setting in launch.json. This works the same as the launch.json settings in VS Code. For more information about skipFiles and other debugger configuration options, see Skipping Uninteresting Code and Launch configuration attributes.
Debug server-side script
With your project open in Visual Studio, open a server-side JavaScript file (such as server.js), click in the gutter to set a breakpoint:
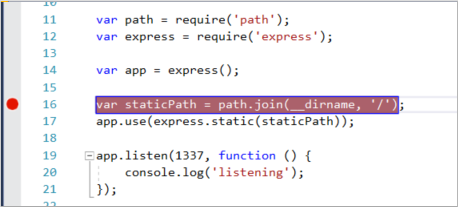
Breakpoints are the most basic and essential feature of reliable debugging. A breakpoint indicates where Visual Studio should suspend your running code, so you can look at the values of variables or the behavior of memory, or whether or not a branch of code is getting run.
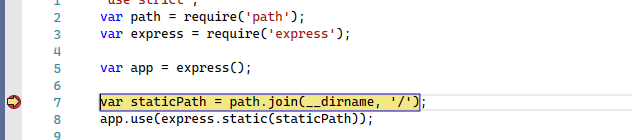
To run your app, press F5 (Debug > Start Debugging).
The debugger pauses at the breakpoint you set (IDE highlights the statement in the yellow background). Now, you can inspect your app state by hovering over variables currently in scope, using debugger windows like the Locals and Watch windows.
Press F5 to continue the app.
If you want to use the Chrome Developer Tools, press F12 in the Chrome browser. Using these tools, you can examine the DOM or interact with the app using the JavaScript Console.
Debug client-side script
Visual Studio provides client-side debugging support only for Chrome and Microsoft Edge. In some scenarios, the debugger automatically hits breakpoints in JavaScript and TypeScript code and embedded scripts on HTML files.
For debugging a client-side script in ASP.NET apps, open the Tools > Options pane and expand the All Settings > Debugging > General section. Select the Enable JavaScript debugging for ASP.NET (Chrome and Edge) option.
If you prefer to use Chrome Developer Tools or F12 Tools for Microsoft Edge to debug client-side script, you should disable this setting.
For more detailed information, see this blog post for Google Chrome. For debugging TypeScript in ASP.NET Core, see Add TypeScript to an existing ASP.NET Core app.
For debugging a client-side script in ASP.NET apps, open the Tools > Options dialog and expand the Debugging > General section. Select the Enable JavaScript debugging for ASP.NET (Chrome, Edge, and IE) option, and then select OK.
If you prefer to use Chrome Developer Tools or F12 Tools for Microsoft Edge to debug client-side script, you should disable this setting.
For more detailed information, see this blog post for Google Chrome. For debugging TypeScript in ASP.NET Core, see Add TypeScript to an existing ASP.NET Core app.
- For .esproj projects in Visual Studio 2022, you can debug client-side script using standard debugging methods to hit breakpoints. To configure debugging, you can modify launch.json settings, which work the same as in VS Code. For more information about debugger configuration options, see Launch configuration attributes.
Note
For ASP.NET and ASP.NET Core, debugging embedded scripts in .CSHTML files isn't supported. JavaScript code must be in separate files to enable debugging.
Prepare your app for debugging
If your source is minified or created by a transpiler like TypeScript or Babel, use source maps for the best debugging experience. You can even attach the debugger to a running client-side script without the source maps. However, you might only be able to set and hit breakpoints in the minified or transpiled file, not in the source file. For example, in a Vue.js app, the minified script gets passed as a string to an eval statement, and there's no way to step through this code effectively using the Visual Studio debugger unless you use source maps. For complex debugging scenarios, you might want to use Chrome Developer Tools or F12 Tools for Microsoft Edge instead.
Manually configure the browser for debugging
In Visual Studio 2022, the procedure described in this section is available only in ASP.NET and ASP.NET Core applications. It's required only in uncommon scenarios where you need to customize browser settings. In .esproj projects, the browser is configured for debugging by default.
For this scenario, use either Microsoft Edge or Chrome.
Close all windows for the target browser, either Microsoft Edge or Chrome instances.
Other browser instances can prevent the browser from opening with debugging enabled. (Browser extensions might be running and intercept full debug mode, so you might need to open Task Manager to find and close unexpected instances of Chrome or Edge.)
For best results, shut down all instances of Chrome, even if you're working with Microsoft Edge. Both the browsers use the same chromium code base.
Start your browser with debugging enabled.
Starting in Visual Studio 2019, you can set the
--remote-debugging-port=9222flag at browser launch by selecting Browse With... > from the Debug toolbar.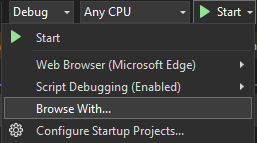
If you don't see the Browse With... command in the Debug toolbar, select a different browser, and then retry.
From the Browse With dialog box, choose Add, and then set the flag in the Arguments field. Use a different friendly name for the browser, like Edge Debug Mode or Chrome Debug Mode. For details, see the Release Notes.
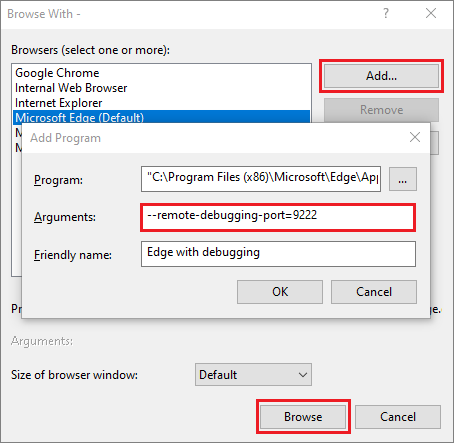
Select Browse to start your app with the browser in debug mode.
Alternatively, open the Run command from the Windows Start button (right-click and choose Run), and enter the following command:
msedge --remote-debugging-port=9222or,
chrome.exe --remote-debugging-port=9222This starts your browser with debugging enabled.
The app isn't yet running, so you get an empty browser page. (If you start the browser using the Run command, you need to paste in the correct URL for your app instance.)
Attach the debugger to client-side script
In some scenarios, you might need to attach the debugger to a running app.
To attach the debugger from Visual Studio and hit breakpoints in the client-side code, it needs help with identifying the correct process. Here's one way to enable it.
Make sure your app is running in the browser in debug mode, as described in the preceding section.
If you created a browser configuration with a friendly name, choose that as your debug target, and then press Ctrl+F5 (Debug > Start Without Debugging) to run the app in the browser.
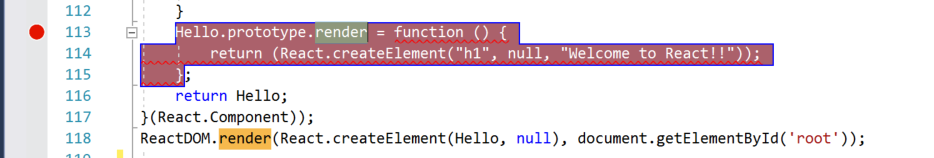
Switch to Visual Studio and then set a breakpoint in your source code, which might be a JavaScript file, TypeScript file, or a JSX file. (Set the breakpoint in a line of code that allows breakpoints, such as a return statement or a var declaration.)
To find the specific code in a transpiled file, use Ctrl+F (Edit > Find and Replace > Quick Find).
For client-side code, to hit a breakpoint in a TypeScript file, .vue, or JSX file typically requires the use of source maps. A source map must be configured correctly to support debugging in Visual Studio.
Choose Debug > Attach to Process.
Tip
Starting in Visual Studio 2017, after you attach to the process the first time by following these steps, you can quickly reattach to the same process by choosing Debug > Reattach to Process.
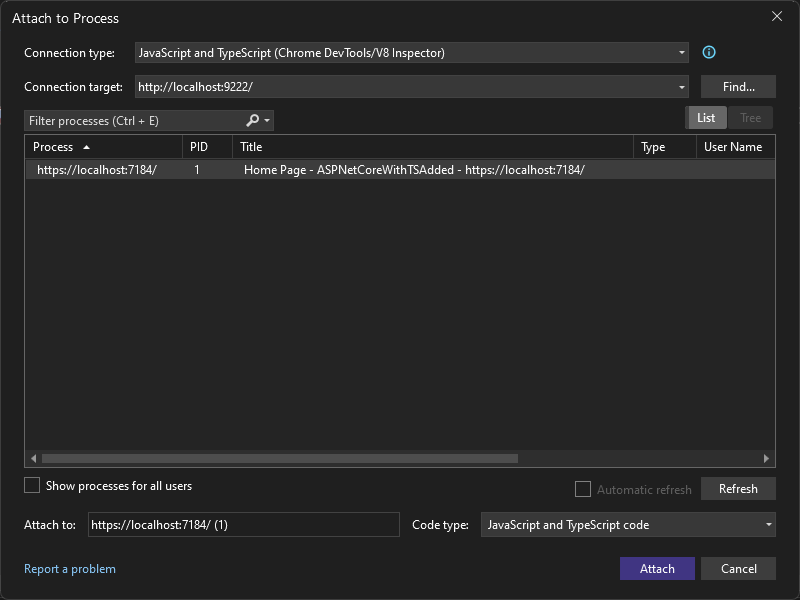
In the Attach to Process dialog, select JavaScript and TypeScript (Chrome Dev Tools/V8 Inspector) as the Connection Type.
The debugger target, such as http://localhost:9222, should appear in the Connection Target field.
In the list of browser instances, select the browser process with the correct host port (
https://localhost:7184/in this example), and select Attach.The port (for example, 7184) might also appear in the Title field to help you select the correct browser instance.
The following example shows how this looks for the Microsoft Edge browser.
Tip
If the debugger doesn't attach and you see the message "Failed to launch debug adapter" or "Unable to attach to the process. An operation isn't legal in the current state.", use the Windows Task Manager to close all instances of the target browser before starting the browser in debugging mode. Browser extensions might be running and preventing full debug mode.
The code with the breakpoint might have already been executed, refresh your browser page. If necessary, take action to cause the code with the breakpoint to execute.
While paused in the debugger, you can examine your app state by hovering over variables and using debugger windows. You can advance the debugger by stepping through code (F5, F10, and F11). For more information on basic debugging features, see First look at the debugger.
You might hit the breakpoint in either a transpiled
.jsfile or source file, depending on your app type, which steps you followed previously, and other factors such as your browser state. Either way, you can step through code and examine variables.If you need to break into code in a TypeScript, JSX, or
.vuesource file and are unable to do it, make sure that your environment is set up correctly, as described in the Source maps section of the VS Code documentation.If you need to break into code in a transpiled JavaScript file (for example, app-bundle.js) and are unable to do it, remove the source map file, filename.js.map.
Debug JavaScript in dynamic files using Razor (ASP.NET)
In Visual Studio 2022, you can debug Razor pages using breakpoints. For more information, see Using Debugging Tools in Visual Studio.